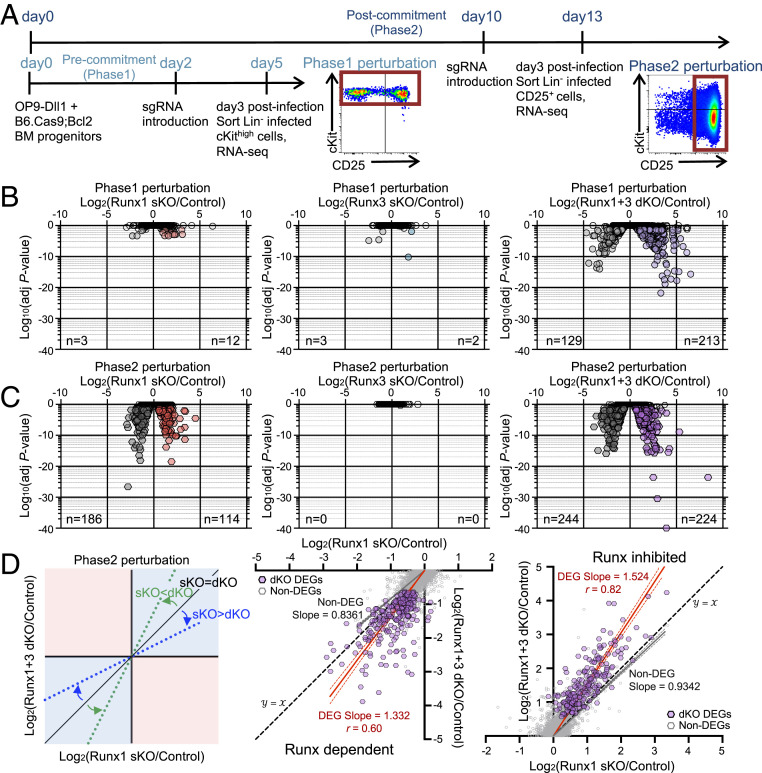
Fig. 4.
Runx1 and Runx3 function in parallel in gene regulation. (A) Experimental schematic for RNA-seq is displayed. RNA-seq measurements were performed on fluorescence-activated cell-sorted sgControl-, sgRunx1-, sgRunx3-, and sgRunx1 + sgRunx3-transduced pro-T cells on day 3 posttransduction (7AAD− Lin− CD45+ CFP+ NGFR+ cells) for Phase1 (cKithigh population) and Phase2 (CD25+ population) perturbations. (B and C) Volcano plots show statistical significance (log10 P value) vs. log2 fold change (FC) of DEGs (average fragments per kilobase-million reads ≥ 1, adjusted P value < 0.05, log2 FC > 0.5 either way) in Phase1 perturbation (B) and Phase2 perturbation (C) groups. n = number of genes scoring as DEGs in each condition. (D) Dot plots show log2 FC of Runx1 sKO vs. Runx1 + Runx3 dKO upon Phase2 perturbation. Trend lines show linear regression results with 95% CI for Phase2 perturbation DEGs (red) and Non-DEGs (gray). Best-fit values for slopes and Pearson correlation r are noted. Data are based on two to three replicate samples of RNA-seq results.

