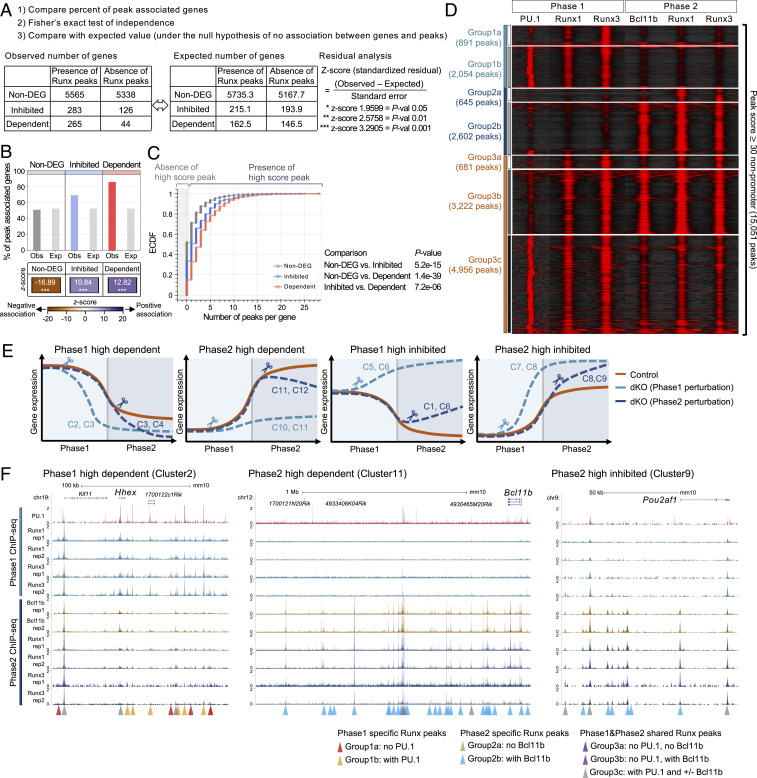
Fig. 6.
Phase-specific collaboration with PU.1 and Bcl11b is associated with Runx functional target genes. (A) Bar graph displays the percentage of the genes associated with peaks, comparing observed values (Obs) and expected values (Exp). z scores (standardized residuals) across categories are shown by the color map. (B) Cumulative frequency of the number of high score peaks found per gene in indicated group. Gray area indicates zero high-score peaks per gene. P values: Kolmogorov–Smirnov test. (C) Peak-centered heat map illustrates ChIP-seq tag count distributions for indicated transcription factors across 15,051 high-quality genomic sites of Runx factor binding in Phase1 and Phase2 stages. High-score peaks indicate nonpromoter Runx binding sites with peak scores ≥ 30. (D) ChIP-seq and RNA-seq integrative analysis strategy is shown. As an example, observed numbers of genes in non-DEG, Runx-inhibited, and Runx-dependent categories with or without any Runx binding peaks are given, compared with a table of expected values if sites were distributed randomly. (E) Diagrams illustrate expression patterns of genes in different clusters from Fig. 5E and SI Appendix, Fig. S9B. C, cluster. (F) Representative genome browser profiles (http://genome.ucsc.edu) are shown with highlighted stage-specific peaks. (Left) Phase1-high Runx-dependent gene (Hhex locus), (Center) Phase2-high Runx-dependent gene (Bcl11b locus), and (Right) Phase2-high Runx-inhibited gene (Pou2af1 locus). Data are based on ChIP-seq peaks scored as reproducible in two biological replicate ChIP-seq samples and two or three replicate samples of RNA-seq results.

