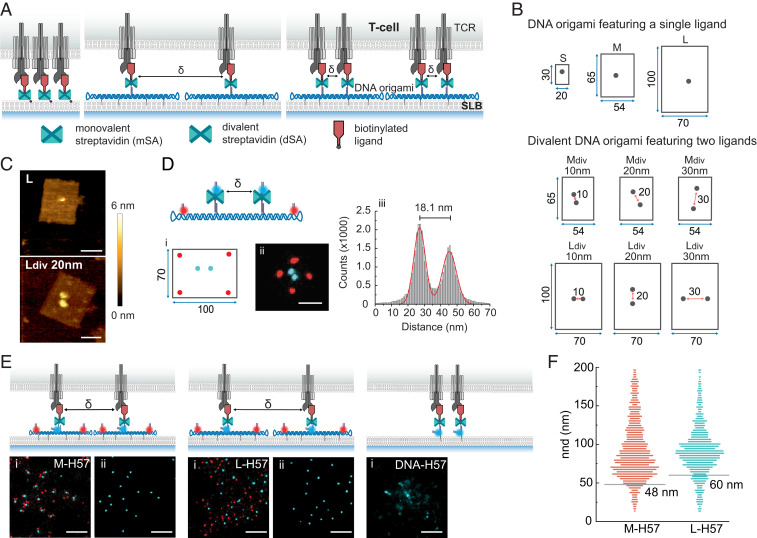
Fig. 1.
Mobile DNA origami platforms for nanoscale ligand organization. (A) Ligands directly anchored to the SLB via mSA can rearrange freely during T cell activation (Left). DNA origami platforms functionalized with ligands at predefined positions and attached to the SLB via cholesterol-modified oligonucleotides set a minimum distance δ between neighboring ligands (Middle). Divalent DNA origami platforms feature two ligands with a predefined δ (Right). (B) DNA origami layouts and nomenclature. DNA origami platforms of different sizes (small, medium, and large) were functionalized with either one (S, M, and L) or two (Mdiv, Ldiv) dSA as indicated in the schemes. Distances are given in nanometers. (C) Representative AFM images of large DNA origami platforms featuring a single ligand or two ligands spaced 20 nm apart. (Scale bar, 50 nm.) (D) Mapping ligand localization on divalent DNA origami platforms via DNA-PAINT superresolution microscopy. (i) Biotinylated ligands were replaced with biotinylated DNA-PAINT docking strands. (ii) Exemplary pseudocolor DNA-PAINT super-resolution image of large DNA origami platforms featuring two ligand attachment sites at 20 nm distance. Ligand (cyan) and platform (red) positions were imaged consecutively by Exchange-PAINT (53) using Cy3B-labeled imager strands. (Scale bar, 50 nm.) (iii) Cross-sectional histogram of ligand positions from summed DNA-PAINT localizations of 100 individual DNA origami platforms. (E) Representative pseudocolor DNA-PAINT super-resolution images of H57-decorated constructs within microclusters showing platform (red) and ligand (cyan) sites (i). Note that due to the position of the imager strand, small discrepancies between the detected position and the actual ligand position are possible. (ii) DNA-PAINT ligand positions after postprocessing. DNA-anchored H57-scFVs free to move without restrictions. DNA-H57 (δ ∼5 nm), M-H57 (δ = 48 nm), and L-H57 (δ = 60 nm) are shown. (Scale bar, 200 nm.) (F) Nnds of ligand positions identified in E. Minimum ligand distances δ are indicated as gray lines. In total, 6.8% and 13.5% of determined nnds were below δ for M and L platforms, respectively. Data are from at least 17 cells recorded in three independent experiments.

