Fig. 4.
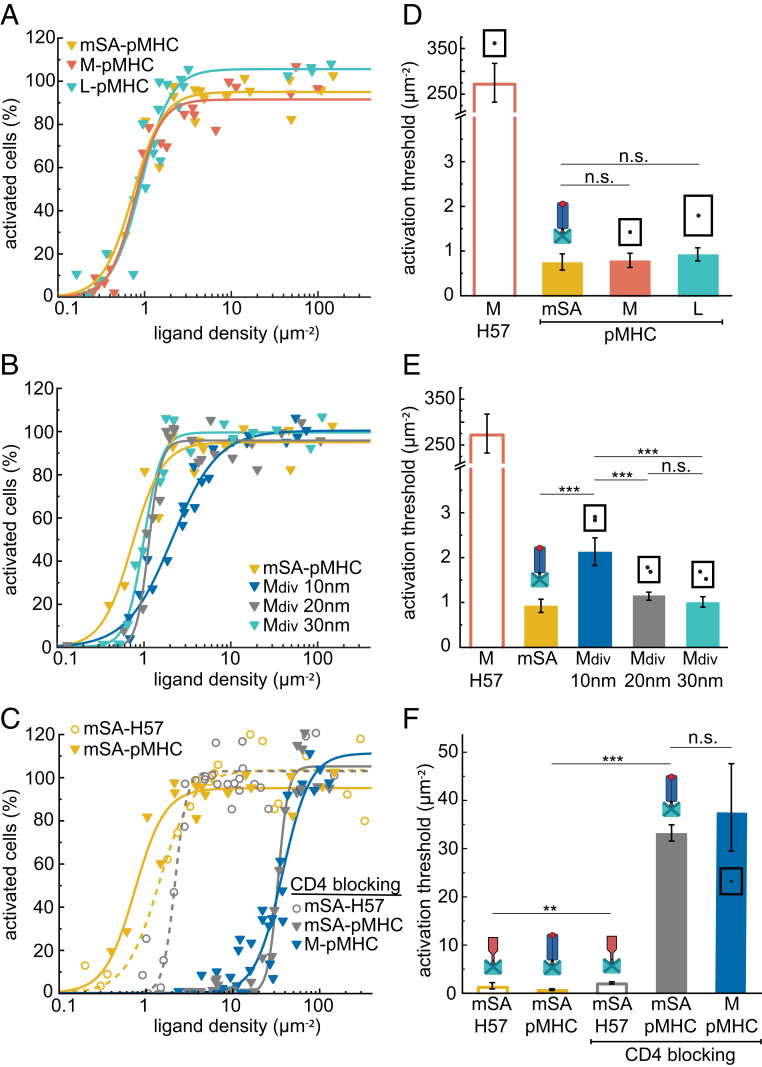
T cell activation is independent of pMHC spacing. Dose–response curves of monovalent (A) and divalent (B) DNA origami platforms featuring pMHC measured at 24 °C and after blocking of CD4 with anti-CD4 Fab (C). Each data point corresponds to the percentage of activated cells determined in an individual experiment at a specific ligand density. For each construct, data are from at least three independent experiments and three different mice. Data for mSA-H57 and M-H57 are shown as references. (D–F) Activation thresholds determined from fits of data from A–C. Error bars represent the 95% CI. ***P < 0.001; **P < 0.05; n.s., not significant. A matrix containing the results of significance tests for all combinations of ligands is shown in Dataset S1.

