Fig. 4.
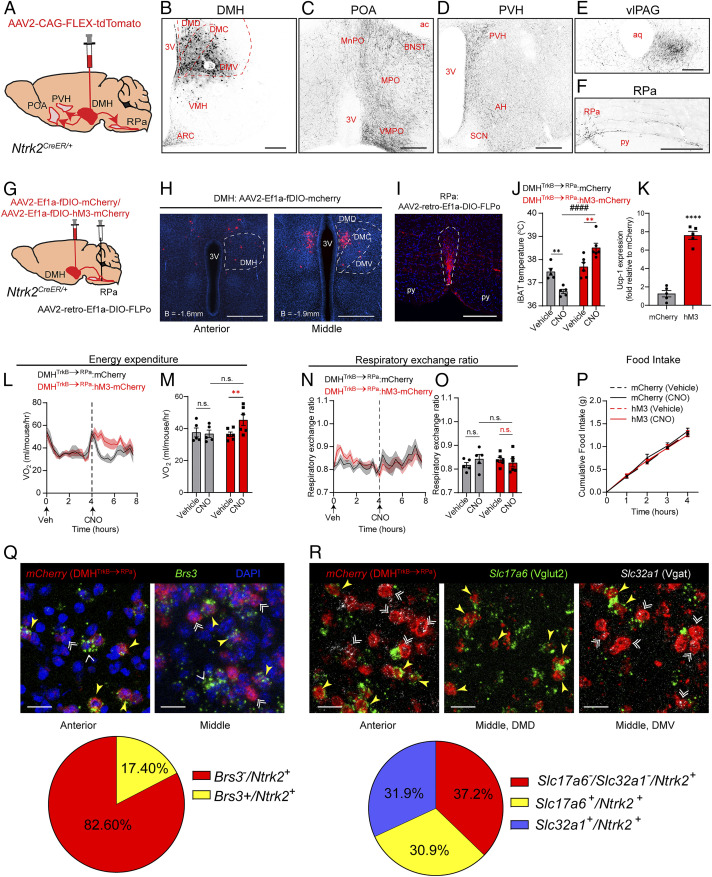
A DMHTrkB → RPa neurocircuit regulates energy expenditure and body temperature. (A) Diagram of anterograde tracing of DMHTrkB neurons in Ntrk2CreER/+ mice unilaterally injected with AAV2-CAG-FLEX-TdTomato. (B) Injection site. (C–F) Projection targets: (C) POA including the median preoptic area, MPO, and VMPO and the BNST; (D) PVH and AH; (E) vlPAG; and (F) RPa. (Scale bars, 200 µm.) (G) Schematic of stereotactic delivery of retrograde AAV expressing Cre-dependent FLPo (AAV2-retro-Ef1a-DIO-FLPo) and AAV2-CMV-GFP to the RPa, and FLP-dependent (fDIO) mCherry or hM3-mCherry expressing virus to the DMH in Ntrk2CreER/+ mice. (H) Expression of mCherry (red) in DMHTrkB→RPa neurons. (Scale bar, 500 µm.) (I) mCherry-labeled DMHTrkB→RPa terminals are detected in the RPa (outlined). (Scale bar, 200 µm.) (J–O) Mice housed at thermoneutrality and expressing hM3-mCherry (red, n = 6) or mCherry (gray, n = 5) in DMHTrkB→RPa neurons were treated with Veh or CNO during the light cycle. (J) BAT temperature 60 min after Veh or CNO treatment. Two-way RM ANOVA: mCherry versus hM3, F(1, 9) = 29.24, and P = 0.0004. (K) Relative levels of Ucp1 mRNA in BAT 2 h post-CNO treatment. Unpaired, two-tailed t test, P < 0.0001. (L) Oxygen consumption after treatment. Two-way RM ANOVA: mCherry versus hM3 (post-CNO), F(1, 9) = 4.695, and P = 0.0584. (M) Average oxygen consumption for the duration of the first 4 h after treatment. Two-way RM ANOVA: mCherry versus hM3, F(1, 9) = 1.227, and P = 0.2967. (N) RER after treatment with vehicle or CNO. Two-way RM ANOVA: mCherry versus hM3 (post-CNO), F(1, 9) = 0.2985, and P = 0.5985. (O) Average RER for the duration of the first 4 h after treatment. Two-way RM ANOVA: mCherry versus hM3, F(1, 9) = 0.03257, and P = 0.8608. (P) Nocturnal food intake of mice expressing mCherry or hM3 in DMHTrkB→RPa neurons after treatment with vehicle or CNO. Two-way RM ANOVA: mCherry versus hM3, F(1, 16) = 0.02664, and P = 0.8724. (Q) Detection of Brs3 (green) and mCherry (red) expression by ISH in the anterior (Left) and middle (Right) DMH of DMHTrkB→RPa:mCherry expressing mice. Yellow arrowheads indicate Brs3+ DMHTrkB→RPa neurons. White double arrowheads indicate Brs3− DMHTrkB→RPa neurons. Single white arrowheads indicate Brs3+ mCherry−. (Scale bars, 20 µm.) (R) In situ detection of Slc17a6 (Vglut2, green) and Slc32a1 (Vgat, white) in the anterior and middle-dorsal and middle-ventral DMH of DMHTrkB→RPa:mCherry mice. Yellow arrowheads indicate Vglut+ DMHTrkB→RPa neurons. Double white arrowheads indicate Vgat+ DMHTrkB→RPa neurons. (Scale bars, 20 µm.) (Q and R) Representative images are from n = 3 animals. Values represent mean ± SEM. Sidak posttest (red * for hM3-Veh versus hM3-CNO, black * for mCherry-Veh versus mCherry-CNO, and # for mCherry versus hM3 post CNO; n.s. = not significant; **P < 0.01; **** and ####, P < 0.0001). 3V, third ventricle; ac, anterior commissure; py, pyramid; SCN, suprachiasmatic nucleus.

