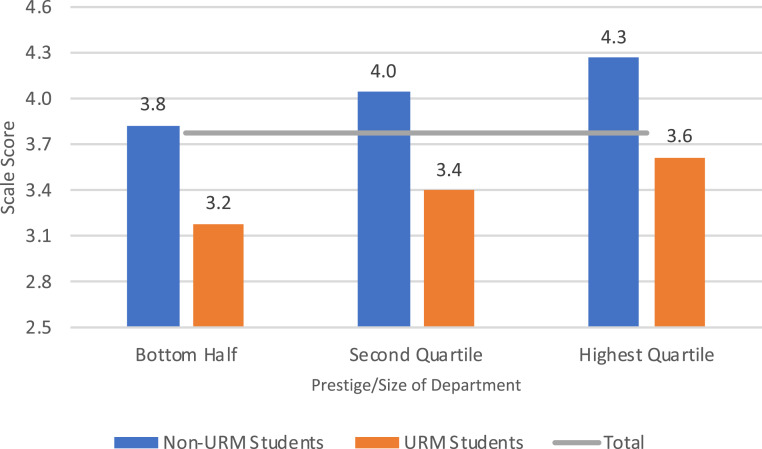
Fig. 2.
Estimated average values, perceived adequacy of financial support by prestige/size of department and identification as URM, controlling for other individual and departmental variables. Note: Perceived adequacy of support measured on a 5-point scale with 5 indicating strongly agree. Mean values estimated from the best-fitting mixed-model regression and included controls for gender, marital status, dependents, value attached to a high paying job, diversity of university, and presence of URM faculty in the department. Estimated means for the measure of departmental prestige and size calculated at the midpoint of each range shown. Horizontal line indicates the average value for all students. Thirty percent of the students (361 non-URM and 47 URM) were in the 50 departments in the bottom half of the prestige/size distribution of departments; 33% (401 non-URM and 44 URM) in the 25 departments in the second quartile; and 38% (486 non-URM and 36 URM) in the 25 departments in the highest quartile. Additional details in SI Appendix.

