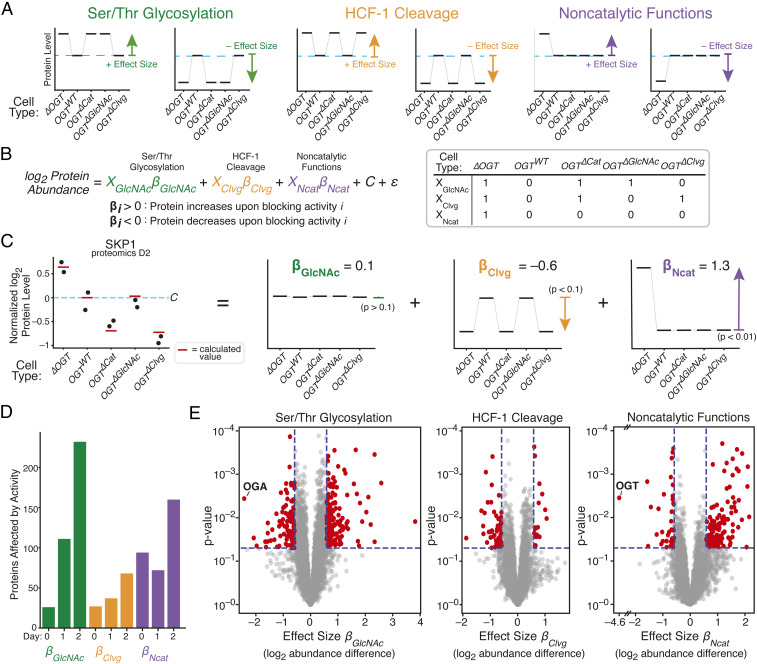
Fig. 4.
Regression measures how single OGT activities alter levels of each protein. (A) Proteins whose levels are controlled by one OGT activity will show characteristic patterns among the five cell lines. Each graph represents a hypothetical protein controlled by a single activity; examples are shown for proteins that increase or decrease in response to inhibiting each activity. Protein level in OGTWT cells is shown by blue dashed line. (B) Linear regression quantifies degree to which protein levels match the patterns corresponding to a given OGT activity. Effect sizes βGlcNAc, βClvg, and βNcat are log2 fold change upon inhibiting an activity, and XGlcNAc, XClvg, and XNcat indicate which cell lines lose a given OGT activity upon dTAG-13 treatment. C is average level in OGTWT cells and ε is random variation unrelated to OGT activity. (C) Protein SKP1 is shown as a regression example; dots are measured abundance, red lines are calculated from linear regression, and individual effects are shown at Right. P values are shown for each effect. Level in OGTWT cells is shown by blue dashed line. (D) Number of hits for each day for each OGT activity. (hits: P < 0.05 and effect size > log2 [1.5]). (E) Volcano plot showing βGlcNAc, βClvg, and βNcat from 2 d of dTAG-13 treatment. OGT and OGA are highlighted as expected outliers. See also SI Appendix, Figs. S3 and S4.

