Fig. 5.
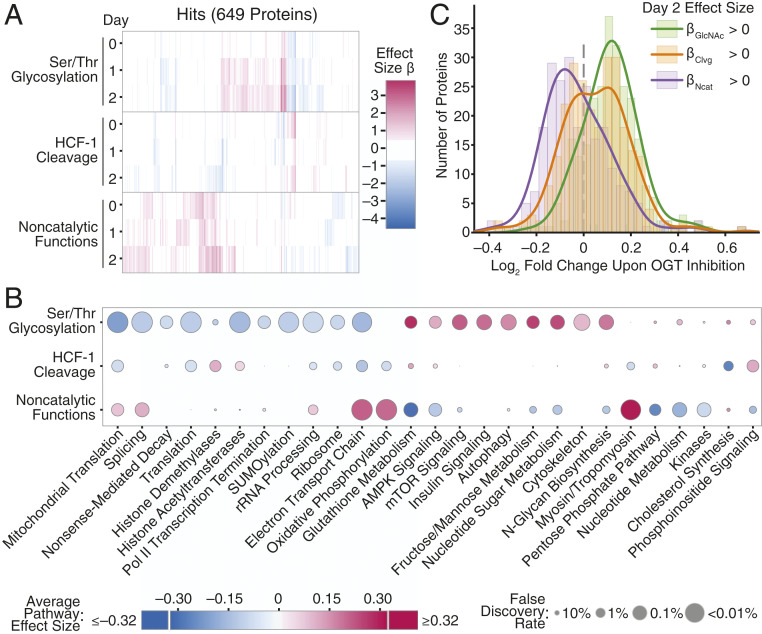
Ser/Thr glycosylation and noncatalytic functions control distinct cellular processes. (A) Heatmap of effect sizes for all 649 protein hits for any OGT activity at any length of dTAG-13 treatment. OGT activity and length of dTAG-13 treatment shown on the y axis. Each x position is a distinct protein. (B) OGT activities control different pathways. Average effect sizes of all proteins (up to 25% change, effect size 0.32) in a given pathway are based on each OGT activity after 2 d of dTAG-13 treatment. Size of points corresponds to false discovery rate from GSEA. (C) Comparison of OGT inhibition and changes due to individual OGT activities. Histograms show log2 fold change in protein abundance upon OGT inhibition (67) for the set of proteins with positive day 2 βGlcNAc (n = 263), βClvg (n = 264), and βNcat (n = 235) values. Lines show smoothed distribution for each set of proteins (Gaussian kernel bandwidth = 0.05). Only proteins significant in regression analysis (P < 0.01 for any effect size, 513 proteins) were analyzed. Proteins with positive effect sizes upon blocking any individual OGT activity had significantly more extreme changes in abundance upon OGT inhibition than expected by chance based on a Wilcoxon rank sum test (P value βGlcNAc <10−26, βClvg <0.01, βNcat <10−10). See also SI Appendix, Figs. S5 and S6.

