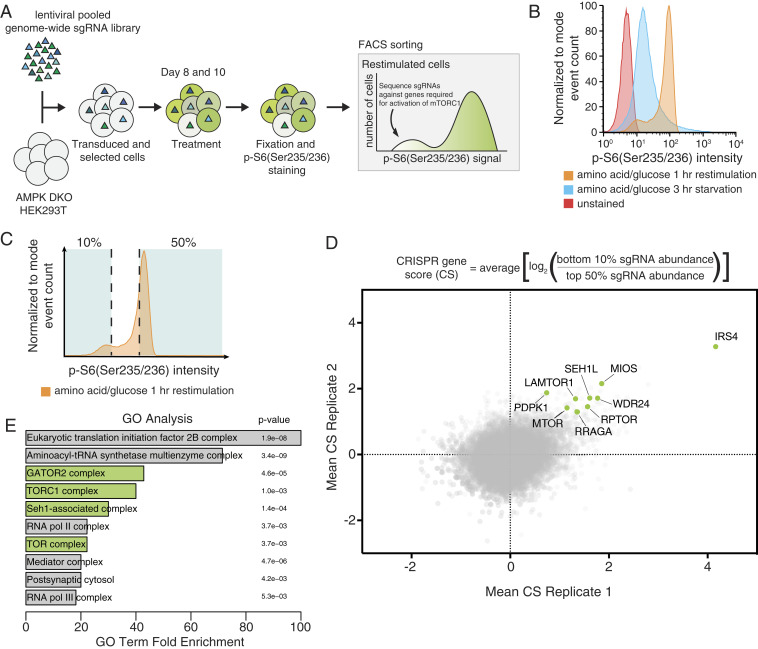
Fig. 1.
CRISPR-Cas9 screen identifies positive regulators of mTORC1. (A) Schematic of the CRISPR-Cas9 FACS-based genome-wide screen. (B) Representative flow cytometry histogram of wild-type HEK293T cells not exposed to the primary antibody (red), or immunostained after starvation of amino acids and glucose (blue), or starved of and restimulated with both (orange). (C) Schematic for FACS collection on a representative starved and restimulated sample of cells. (D) Equation for determining CRISPR scores (CSs). Known mTORC1 regulators are highlighted in green. Positive CRISPR scores indicate genes that when lost prevented cells from fully reactivating mTORC1 upon combined glucose and amino acid restimulation as readout by p-S6 levels. Mean CS from two biological replicates of genome-wide screens in AMPK DKO HEK293T cells. (E) GO analysis shows enrichment of mTORC1-related complexes in an unbiased manner. Analysis was performed on the 106 top scoring genes, which had an FDR of <0.05.

