Significance
The retention and accumulation of biotherapeutic agents within the circulatory system are difficult due to the high velocity of the blood flow, which limits drug leakage and drug concentration in the targeted region. Herein, we propose a tornado-inspired acoustic vortex tweezers to noninvasively collect microbubbles for improved local concentration of up to 1.7-fold in vitro and in vivo. This technique enables systemic drug administration with extremely low doses.
Keywords: ultrasound, microbubbles, acoustic tweezers, acoustic vortex, trapping
Abstract
Spatially concentrating and manipulating biotherapeutic agents within the circulatory system is a longstanding challenge in medical applications due to the high velocity of blood flow, which greatly limits drug leakage and retention of the drug in the targeted region. To circumvent the disadvantages of current methods for systemic drug delivery, we propose tornado-inspired acoustic vortex tweezer (AVT) that generates net forces for noninvasive intravascular trapping of lipid-shelled gaseous microbubbles (MBs). MBs are used in a diverse range of medical applications, including as ultrasound contrast agents, for permeabilizing vessels, and as drug/gene carriers. We demonstrate that AVT can be used to successfully trap MBs and increase their local concentration in both static and flow conditions. Furthermore, MBs signals within mouse capillaries could be locally improved 1.7-fold and the location of trapped MBs could still be manipulated during the initiation of AVT. The proposed AVT technique is a compact, easy-to-use, and biocompatible method that enables systemic drug administration with extremely low doses.
Highly diverse drugs have been developed globally in recent years, providing the promise of better prevention, treatments, and cures for a broad range of diseases. When drugs are systemically administered, accurate targeted delivery of the drug to the diseased cells and tissues at sufficiently high doses is critical for drug function. For example, it has been reported that less than 0.7% of an injected drug actually gets into a targeted tumor (1). The high velocity of blood flow (∼1.5–33 cm/s in capillaries and venules) is the main obstacle for circulation-based drug delivery because drug leakage and retention in the targeted region are limited (2). Developing an approach that can noninvasively concentrate and manipulate circulating drugs to propel or navigate them against the flow could greatly improve treatment efficiencies, reduce required administered doses, and avoid off-target effects.
Emerging techniques for contactless trapping and manipulation of biomolecules such as DNA, cells, nanoparticles, and microparticles with a high spatial resolution typically utilize optical, magnetic, or electrokinetic forces (3–11). However, each of the current techniques has its own potential drawbacks: 1) optical tweezers may cause physiological and heat damage to cells, high photon absorption in biological materials, and the formation of singlet oxygen (9, 12–14); 2) magnetic tweezers require targets to be prelabeled with magnetic materials, which likely affects cell viability (6, 8, 10, 15); and 3) electrokinetic tweezers can potentially affect cell physiology due to current-induced heating or direct exposure to an electric field (3–5, 16). In other words, these potent bioeffects combined with their short working distances (<1 cm) greatly limit the ability to translate these techniques into clinical applications. The safety and tissue-penetrating ability (∼20 cm) of ultrasound may provide an alternative option for developing so-called acoustic tweezers.
A substantial number of acoustic-tweezer configurations have been explored previously for applications in science, engineering, and biomedical sciences. The three primary types of acoustic tweezers are standing-wave tweezers (17–19), single-beam acoustic tweezers (20–22), and acoustic-streaming tweezers (23–25). Standing-wave tweezers spatially form periodic pressure nodes to produce acoustic radiation forces that can be used to control the positions of particles (19). Unfortunately, a complex setup is needed because the trapped objects need to be located between one or more pairs of ultrasound transducers. Single-beam acoustic tweezers can produce a trapping effect to manipulate particles and cells under the conditions of Mie regime in a single-transducer setup (21, 26). However, high operating frequencies are required for this technique because the acoustic wavelength needs to be smaller than the size of the trapped particles or cells. Acoustic-streaming tweezers can be used to indirectly manipulate particles via acoustic-induced fluid flows (also termed acoustic streaming) with oscillating gas-filled microbubbles (MBs) or solid structures (25). The streaming flows generate regions of recirculation or pressure gradients that can be used to influence particle position. The oscillating MBs also produce acoustic radiation forces and streaming vortices to trap and rotate particles, respectively. The low spatial resolution is the main drawback of this type of tweezers, because MBs and microstructure-based phenomena are nonlinear. Although acoustic tweezers have been increasingly used for manipulating cells, particles, and organisms, there are very few reports of promising results in an in vivo environment. For example, the single-beam acoustic tweezers could penetrate through an ex vivo rat aorta and manipulate polystyrene microspheres of 3-µm size inside the vessel (22). However, in order to trap micrometer-size particles, it is necessary to operate such acoustic tweezers with high frequency (∼40 MHz; wavelength: tens of micrometers). The poor tissue penetration of such high-frequency ultrasound would largely limit the in vivo application of single-beam acoustic tweezers.
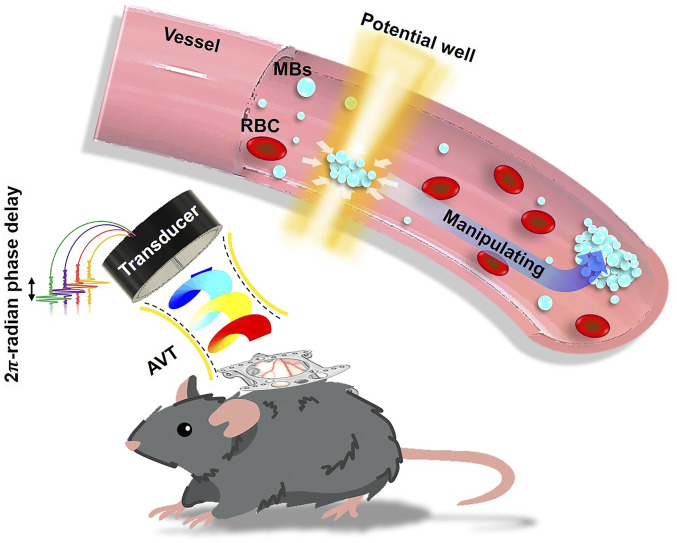
Ideal acoustic tweezers for in vivo applications must meet the following conditions: long penetration depth, strong trapping force, simple setup, multiaxis manipulation, and tissue safety. With the aim of meeting these requirements, we focused on a tornado-inspired acoustic vortex tweezer (AVT) concept that we previously demonstrated is feasible (26, 27). AVT employ destructive interference to produce a ring-shaped beam pattern called a potential well. According to the force-potential mechanism operating in a Rayleigh regime, particles with high acoustic impedances comparing with blood will experience strong trapping forces that drive them toward the beam axis. Here we report on an acoustic-tweezer transducer based on AVT theory that aims to trap and manipulate bioparticles (lipid-shelled gaseous MBs) within the blood circulation in vivo (Fig. 1).
Fig. 1.
Concept and paradigm of the study. Tornado-inspired AVT were used to generate a potential well for the noninvasive intravascular trapping of lipid-shelled gaseous MBs within the circulation in vivo. RBC, red blood cell.
Several studies have demonstrated the diversity of uses for MBs in medical applications, such as their use as sonography contrast agents, for permeabilization of the blood–brain barrier, and as drug/gene carriers (28–31). A new technique should not only address the current shortcomings, but also improve the imaging contrast and the efficiency of drug delivery. This paper first demonstrates the trapping of MBs using the technique in a static condition. Then, the trapping performance and possible side effects in a flow condition are investigated in detail. Finally, the feasibility of in vivo trapping and safety issues are investigated in a dorsal window chamber model.
Results
Method Principle and Transducer Design.
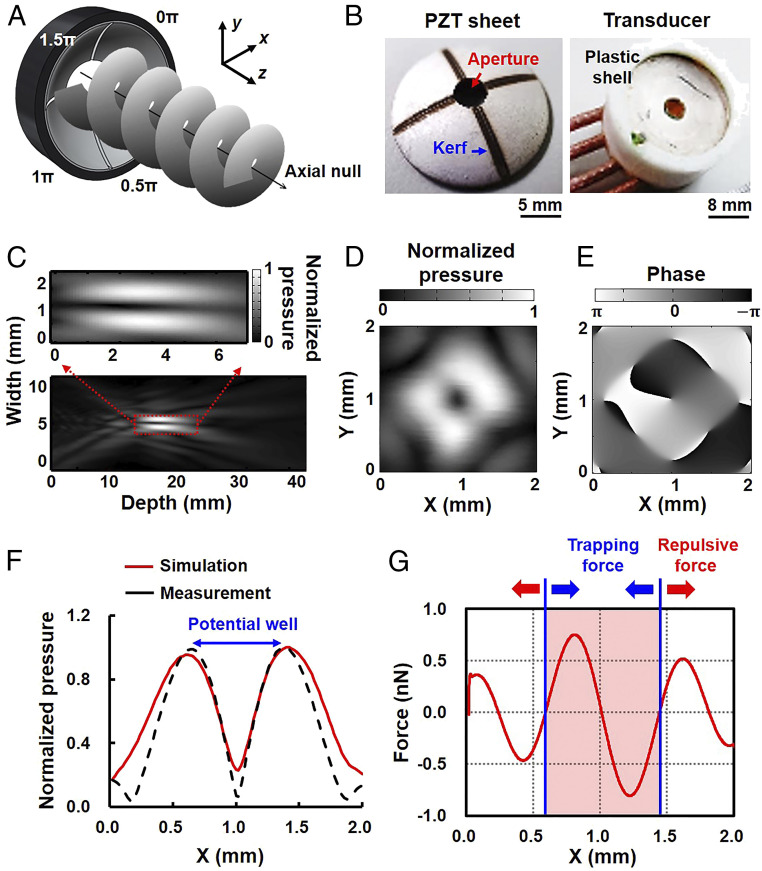
The working mechanism of AVT is illustrated in Fig. 2A. In our model, the acoustic waves that emanate from the transducer elements propagate along the z direction, and phase difference around the axis gradually varies from 0 to 2π radians in each x-y plane. The phase is indeterminate on the axis, which leads to the generation of a null core of zero amplitude, creating a vortex structure with an axial null (corresponding to a minimum or zero in the pressure amplitude), which is called a potential well. The particles near the axial null experience an inward force and thus can be trapped.
Fig. 2.
AVT transducer design and acoustic vortex generation. (A) Sketch of the four-element AVT transducer adjacent elements that had a π/2-rad phase difference. (B, Left) A curved lead zirconate titanate (PZT) piezocomposite with a 1-mm kerf and 3-mm-diameter aperture observed under bright-field microscopy. (B, Right) A three-dimensionally printed polylactic acid packaging of the transducer for ensuring water resistance. (C) Pressure field measured along the direction of AVT-generated wavefront propagation (x-z plane at y = 0 mm). (Inset) Local magnification of the focal zone. (D) Transverse pressure field measured at the focal point (z = 20 mm), from which the ring pattern can be inferred from the vortex feature. (E) Phase distribution corresponding to the transverse pressure field at the focal point. (F) Comparison of the measured and simulated pressure fields in the lateral direction. The pressure distribution shows that an axial null was bounded by a high acoustic pressure, generating a potential-well structure. Note that the measured pressure field was acquired from D at y = 1 mm. (G) Profile of the lateral radiation forces when a 1.1-µm MB was sonicated at an acoustic pressure of 800 kPa and a duty cycle of 30%. These data show that the MBs near the axial null will experience a radiation force that drives them toward the beam center, which is called the trapping force (blue arrow). However, the MBs in the outer vortex would experience a radiation force to repel them, which is called the repulsive force (red arrow). The trapping region had a size of 0.85 mm.
In order to transmit the acoustic wave with a π/2-rad phase difference, a single 3-MHz concave lead zirconate titanate (PZT) substrate (diameter: 20 mm; curvature: 20 mm; f number: 1) was used to fabricate the AVT transducer. An aperture with a diameter of 3 mm was drilled in the PZT substrate to create a light path for bright-field microscopy observations (Fig. 2B). The PZT substrate was then carved into four individual elements with a 1-mm kerf on the back electrode using a laser cutter (32). Coaxial signal and ground wires were soldered to the electrodes of each element, with the entire assembly then sealed in a cylindrical plastic shell. The four elements were driven by 3-MHz sine waves to produce pressures of 80–800 kPa. During signal transmission there was a π/2-rad phase difference between adjacent elements. Based on simulation data, the focal length, focal zone, and beam width of the designed transducer were calculated to be ∼20, 5, and 1.7 mm, respectively (SI Appendix, Fig. S1) (33, 34).
The acoustic field of the AVT was measured, and its cross-section in the x-z plane at y = 0 is shown in Fig. 2C. The normalized distribution of pressure showed that the focal length and beam width of AVT were 20 and 1.7 mm, respectively, which was consistent with the simulation data. The axial null appeared as a dark region along the beam axis that resulted from the destructive interference of the corkscrew wavefronts, corresponding to a minimum or zero in the pressure amplitude (33). In the transverse x-y plane at z = 20 mm, the pressure distribution appeared as a doughnut structure with four main lobes (Fig. 2D), indicating that the axial null was surrounded by high acoustic pressures. The corresponding phase pattern also verified the phase shifts of the wavefronts from –π to π radians, as expected (Fig. 2E). This variation indicated that the generated acoustic vortex carried angular momentum (with a topological charge of 1), potentially allowing momentum to be transferred to the medium and particles during the initiation of the AVT (35). The transverse profile in Fig. 2F further reveals that the acoustic vortex generated pressure distribution and eventually formed a potential well. The measured pressure field was also similar to the simulation data.
The simulated potential distribution by applying a peak negative pressure of 800 kPa and a 30% duty cycle to a 1.1-µm MB is shown in Fig. 2G, and indicates that MB near the beam axis would experience a radiation force pushing them into the beam center, with a maximum trapping force of 0.75 nN. This region with steep inward forces can thus be referred to as the trapping region, with the largest dimension in the plane being 0.85 mm. However, the MB in the outer vortex would experience a radiation force repelling them with a maximum force of 0.52 nN, called the repulsive force. The repulsive force was smaller than the trapping force because the pressure gradient in the outer vortex is much gentler than that near the axial null (Fig. 2F). These data suggest that our device successfully generated a potential well in the acoustic vortex, within which suspended MBs might be driven toward the center and stably confined.
Trapping of MBs in the Static Condition.
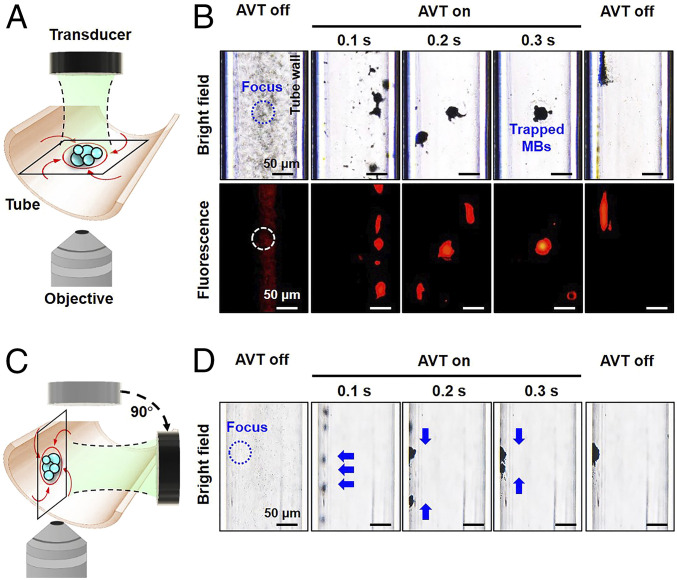
The trapping effect of the potential well generated by AVT was then verified by observing MBs microscopically in a static condition. The MBs had a perfluoropropane (C3F8) gas core and a lipid shell constructed from 1,2-dipalmitoyl-sn-glycero-3-phosphocholine, 1,2-Distearoyl-sn-glycero-3-phosphoglycerol, and 1,2-distearoyl-sn-glycero-3-phosphoethanolamine-N-[carboxy(polyethylene glycol)-5000], which are commonly used in pharmaceutical formulations. The lipid shell of the MBs was labeled with the lipophilic fluorescent probe DiI to allow visualization using fluorescence microscopy (SI Appendix, Fig. S2). MBs with a diameter of 1.1 ± 0.5 µm (mean± SD) and a mean concentration of 10.0 × 10⁸ MBs/mL were exposed to AVT producing a peak negative pressure of 800 kPa and a duty cycle of 30% in a cellulose tube with a diameter of 200 µm (Fig. 3A).
Fig. 3.
Trapping behavior of MBs observed under an inverted microscope in the static condition. (A) Experimental setup in which the AVT transducer was placed on the top to trap MBs for bottom-view observations. (B) Series of bright-field (Top) and fluorescent (Bottom) images. During the trapping sequence, the MBs were swirled into the AVT center to form a large cluster. (C) The AVT transducer was rotated 90° to record the trapping behavior from a side view. (D) Series of side-view images showing that MBs initially experience the radiation force pushing on the wall and then the trapping force that immediately collects the dispersed clusters into the center of the AVT focal zone. The MB concentration was 10.0 × 10⁸ MBs per milliliter and AVT were applied at an acoustic pressure of 800 kPa and a duty cycle of 30%.
Fig. 3B depicts the MBs dynamics during AVT initiation detected using bright-field and fluorescence microscopy imaging. The MBs appeared dark in bright-field imaging due to the reflection and refraction of the transmitted light. Upon initiation of the trapping, the suspended MBs rapidly spiraled clockwise around the beam axis due to phase dislocations around the axis, as expected. These MBs subsequently started to aggregate due to the presence of the aforementioned radiation force, and the aggregated MBs persistently swirled around and ultimately became trapped in the center, thereby forming an MB cluster (Movie S1). The direction in which the MBs swirled depended on the direction of the phase dislocation generated by the AVT (Fig. 2E), which also confirmed the occurrence of momentum transfer. When the AVT was turned off, the MB cluster quickly dispersed, suggesting that the AVT induce temporary MBs aggregation.
Further investigations from a side view provided insight into the MBs behaviors during AVT trapping. Moving the AVT transducer and objective to the side surface of the tube made the optical focal plane nearly perpendicular to the wall during the trapping process (Fig. 3C). Under the same experimental conditions as for Fig. 3B, the acquired images showed that the MBs initially aggregated and were displaced along the wave propagation direction relative to the wall. The aggregated MBs were then further squeezed to form a sphere cluster in the beam center along the wall (Fig. 3D; also see Movie S2). Viewing from the two orthogonal directions confirmed that AVT induce concentration and trapping of the suspended MBs along an adjacent wall. Previous studies have found that the therapeutic effect and drug delivery efficiency of MBs could benefit from local increases in their concentration (36–38), suggesting that applying AVT with MBs could have great potential in vascular targeting applications. Moreover, our previous simulations suggested that AVT could also be applied to other particles of the same size and shape, but constituting different materials (i.e., Teflon, polystyrene, and cellulose) (27).
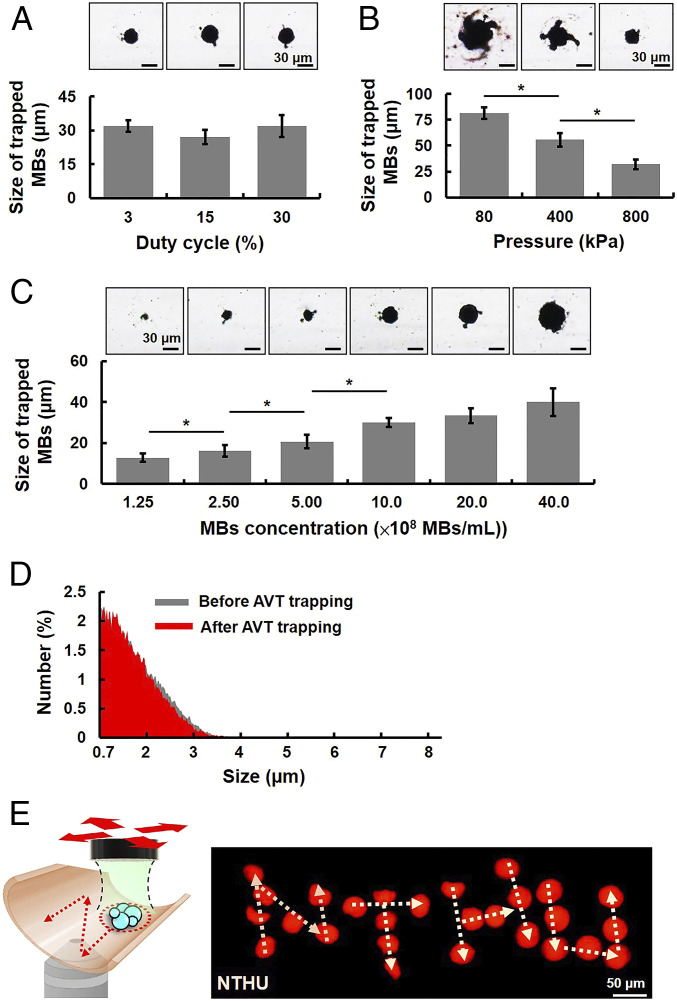
The MBs trapping efficiency of AVT was investigated by varying the peak negative pressure (80–800 kPa), duty cycle (3–30%), and MBs concentration (1.25–40.0 × 10⁸ MBs/mL). The trapping efficiency was assessed by calculating the size of the MB cluster using bright-field microscopy imaging. Increasing the duty cycle did not increase the size of the MB cluster, since it was 32.2 ± 2.6, 27.1 ± 3.2, and 32.1 ± 4.8 µm for duty cycles of 3, 15, and 30%, respectively (Fig. 4A). The trapping effects first appeared when applying a pressure of 80 kPa (Fig. 4B). However, increasing the pressure significantly decreased the size of the MB cluster, with sizes of 81.1 ± 5.6, 55.6 ± 6.5, and 32.0 ± 4.8 µm for pressures of 80, 400, and 800 kPa, respectively. This situation was probably caused by 1) the pressure gradient increasing with the acoustic pressure and 2) MBs moving toward each other due to secondary acoustic radiation forces, which vary with the square of the pressure magnitude (39). Therefore, increasing the acoustic pressure would reduce the distance between adjacent MBs and hence reduce the size of the MB cluster. Increasing the concentration of MBs over the range from 1.25 × 10⁸ to 40.0 × 10⁸ MBs per milliliter produced a large increase in the size of the MB cluster, with sizes of 12.70 ± 2.00, 16.10 ± 2.80, 20.6 ± 3.3, and 30.10 ± 2.18 µm for concentrations of 1.25 × 10⁸, 2.50 × 10⁸, 5.00 × 10⁸, and 10.0 × 10⁸ MBs per milliliter, respectively (Fig. 4C). However, further increasing the concentration to 20.0 × 10⁸ and 40.0 × 10⁸ MBs per milliliter did not increase the size of the MB cluster (33.30 ± 3.67 and 40.00 ± 6.82 µm, respectively). These findings suggest that the AVT trapping efficiency was dominated by the MBs concentration and the acoustic pressure, which could probably be achieved by using a low duty cycle in order to avoid a thermal effect. Also, these properties revealed a method for adjusting the size of the trapped MB cluster according to the requirements of specific medical applications. In order to maximize the trapping force generated by the AVT, three parameters were selected for subsequent experiments: an acoustic pressure of 800 kPa, a duty cycle of 30%, and an MBs concentration of 10.0 × 10⁸ MBs. Under these parameters, an experiment was designed to explore the number of MBs within the cluster (SI Appendix, Fig. S3 A–C). The results revealed that the number of MBs within the cluster was ∼556 (SI Appendix, Fig. S3 D–F). It is rational of such a small number of trapped MBs because MBs outside the vortex would experience a repulsive force and only the MBs inside the focal zone could be trapped.
Fig. 4.
Effects of ultrasound parameters on the MBs trapping efficiency. (A) The effect of duty cycle. Bright-field microscopy images (Upper) and corresponding sizes of trapped MBs (Lower) under different duty cycles (3–30%). The cluster size was not affected by increasing the duty cycle. The MBs concentration was 10.0 × 10⁸ MBs per milliliter and the acoustic pressure was 800 kPa. (B) The effect of acoustic pressure. Bright-field microscopy images (Upper) and corresponding sizes of trapped MB cluster (Lower) under different acoustic pressures (80–800 kPa). The cluster size decreased as the acoustic pressure increased. The MBs concentration and the duty cycle were 10.0 × 10⁸ MBs per milliliter and 30% m, respectively. (C) The effect of MB concentration. Bright-field microscopy images (Upper) and the sizes of corresponding trapped MBs (Lower) under different MBs concentrations (1.25–40.0 × 10⁸ MBs per milliliter). The cluster size increased with the MBs concentration. (D) The size distribution of MBs before and after AVT trapping. The acoustic pressure was 800 kPa, the duty cycle was 30%, and the MBs concentration was 10.0 × 10⁸ MBs per milliliter. (E) Stacked images showing dynamic control of trapped MBs to write “NTHU” (National Tsing Hua University) in the static condition. *P < 0.05.
One concern about this technique is whether AVT trapping produces permanent MBs coalescence or aggregation. In order to assess if the trapped MBs would lead to MBs coalescence (>8 μm), the trapped MBs were collected and their size distribution was analyzed (SI Appendix, Fig. S4). No significant change of MBs size distribution was observed before and after AVT trapping (mean size: 1.1 ± 0.5 µm vs. 1.1 ± 0.1 µm; ratio of particle size <8 µm: 96.8 ± 1.8% vs. 97.6 ± 1.2%) (Fig. 4D), suggesting that the AVT-generated effect onto MBs was temporal and reversible. Besides, the smallest diameter of blood capillaries in vivo is ∼6–8 μm, potentially indicating that this technique did not lead to the clustering of MBs and occlude small capillaries (40–42). In addition, to confirm the manipulation capabilities of AVT within a narrow space such as a vascular wall, the trapped MB cluster was moved in two dimensions so as to generate the letters “N,” “T,” “H,” and “U” by adjusting the x-y position of the AVT transducer. The trajectory of trapped MBs was recorded, as shown by the superpositioning in Fig. 4E. This manipulation trajectory agrees well with the expected trajectory.
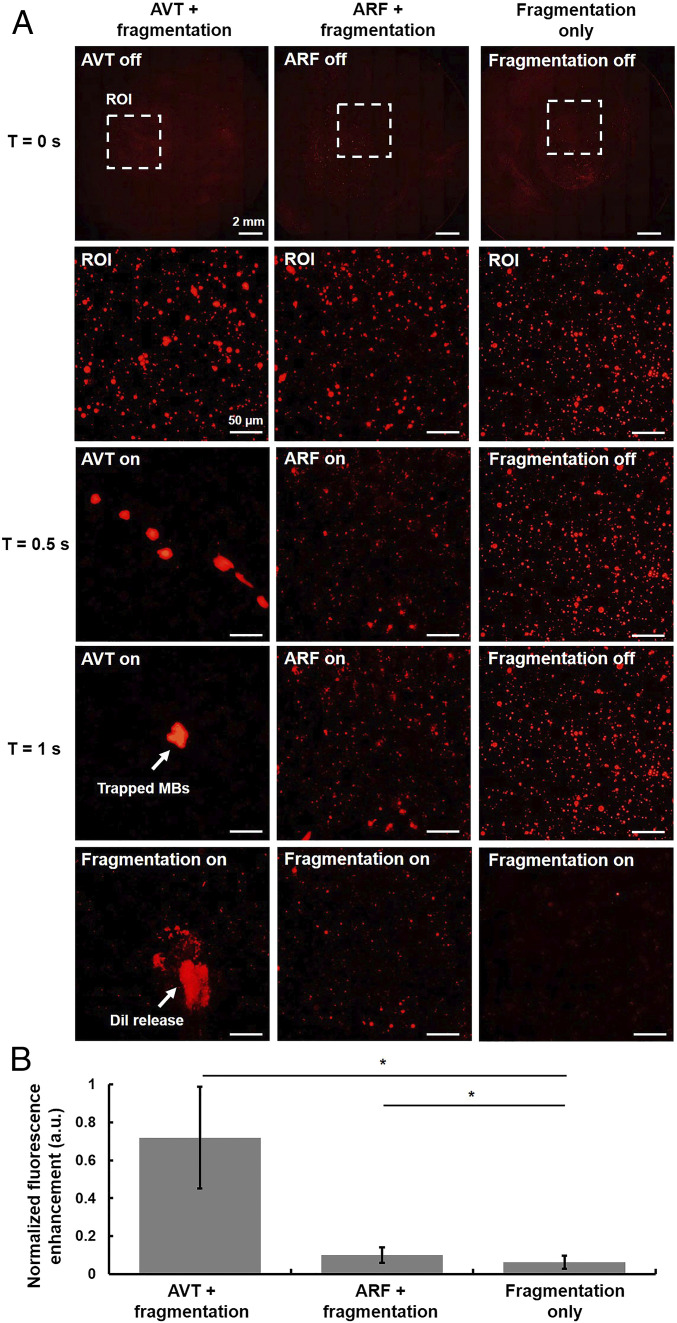
We hypothesized that the pulses with the trapping effects and those that produced fragments of MBs could be used together, in sequence, to improve local drug delivery (43). In other words, AVT pulses can firstly concentrate the surrounding free MBs and fragmentation pulses can then trigger the MBs to rupture, spraying the cargo of the MBs into the surrounding area (SI Appendix, Fig. S5). The acoustic parameters of each sequence are listed in SI Appendix, Table S1. Fig. 5A shows a typical result from these pulse sequences: the case of AVT trapping fragmentation shows the most fluorescence in the AVT focus, the case of acoustic radiation force (ARF) fragmentation shows some fluorescence, and the case of fragmentation only shows no fluorescence. The quantification analysis suggests that the application of AVT trapping fragmentation produces a 7.2- and 11.9-fold increase in fluorescent intensity compared with those of the ARF-fragmentation group and fragmentation only group, respectively (Fig. 5B). These data indicate that our proposed AVT trapping method can be used to improve the efficiency of drug delivery.
Fig. 5.
In vitro AVT-enhanced drug delivery. (A) Sequential microscopic images of the glass with different drug delivery sequence (AVT + fragmentation, ARF + fragmentation, and fragmentation only). Note that the MBs concentration was 40 × 106 MBs per milliliter ARF: 160 kPa, 30% duty cycle; fragmentation: 1,600 kPa, a single pulse, five cycles. (B) The corresponding fluorescence intensity of each groups.
Trapping of MBs in the Flow Condition.
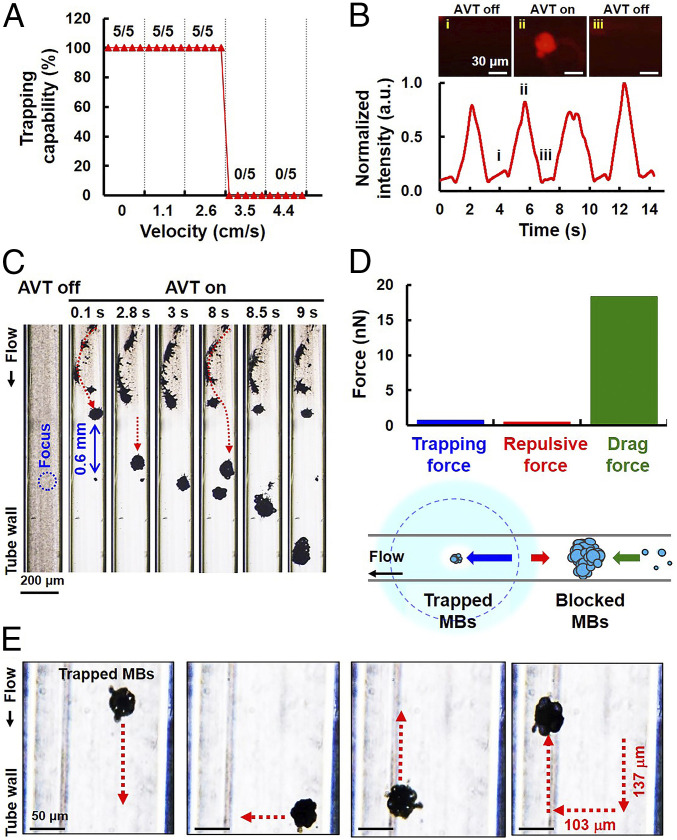
The velocities of the blood flow in arterioles, venules, and capillaries within the human systemic circulation may vary within ranges of 1–20, 5–10, and 1–4 cm/s (44, 45), respectively. The effect of flow velocity on the trapping of MBs by AVT was therefore investigated for a range of 0–4.4 cm/s. Fig. 6A illustrates that MBs could be successfully trapped as the flow velocity was increased to 2.6 cm/s, but the trapping capability was completely lost for velocities that exceeded 3.5 cm/s. By examining trapping failures for different flow velocities, we next investigated if MBs could be repeatedly trapped by AVT in the flow condition (Fig. 6B). AVT trapping were performed every 4 s at a velocity of 2.6 cm/s. The initiation of trapping resulted in a steady (∼9-fold) increase in local florescence signals due to the local increase in the MBs concentration. The fluorescence signals decreased rapidly when the AVT were turned off, which also suggested that the MB cluster had dispersed.
Fig. 6.
Trapping of MBs in the flow condition. (A) Relation between trapping capability and flow velocity. The data show that flowing MBs could be successfully trapped by AVT when the flow velocity was less than 3.5 cm/s. (B) The MBs could be trapped periodically in the flow through repeatedly switching the AVT on and off. The local fluorescent intensity showed rapid increases and decreases, suggesting the presence of MB aggregation and dispersion. (C) Zoomed-out view showing the formation of an upstream MB cluster during AVT initiation, which finally results in trapping failure. The flow velocity was 2.6 cm/s. (D, Lower) Conceptual illustration showing that MBs could be successfully trapped in the flow condition by the competitive interaction of the trapping, repulsive, and drag forces. (D, Upper) Comparison of trapping, repulsive, and drag forces at 2.8 s. (E) Stacked images used to demonstrate independent motion in the x and y directions by trapped MBs at a flow velocity of 2.6 cm/s.
Expanding the observation zone to outside the AVT trapping area for a flow velocity of 2.6 cm/s showed that blocked MBs upstream might play an important role in trapping failure (red dotted arrows in Fig. 6C; also see Movie S3). In our model, the MBs that are initially outside the vortex would experience a repulsive force. The trapped MB cluster and the upstream MB cluster were separated by 0.6 mm, which is consistent with the estimated distance between the trapping center and the location of the maximum repulsive force (Fig. 2G). In other words, the potential within the inlet region would impede MBs entering the trapping region, leading to the inflow MBs clustering over time. Meanwhile, the drag force on the MB cluster increased with cluster size. Once the drag force of the MB cluster would overcome the repulsive force of the vortex, it would enter the trapping region and wash away the initially trapped MBs, as observed in Fig. 6C. In this system, MBs were successful trapped in a flow condition by the competitive interactions of the trapping, repulsive, and drag forces (Fig. 6D). The quantified Stokes drag force on the upstream MB cluster at 2.8 s had a magnitude of 18.3 nN, which indeed overwhelmed the repulsive force (0.5 nN) and the trapping force (0.8 nN), therefore resulting in trapping failure. Increasing the flow velocity would hasten the formation of the upstream MB cluster. Under the same experimental conditions, we trapped and independently translated the MB cluster in the x and y directions at an average velocity of 0.036 mm/s (Fig. 6E; also see Movie S4). The successful manipulation of the MB cluster in either of these directions indicated that the trapping force of AVT was also effective against the opposing flow (at 2.6 cm/s) and thus moved MBs to the desired location.
AVT Only Trapped MBs, but Not Red Blood Cells.
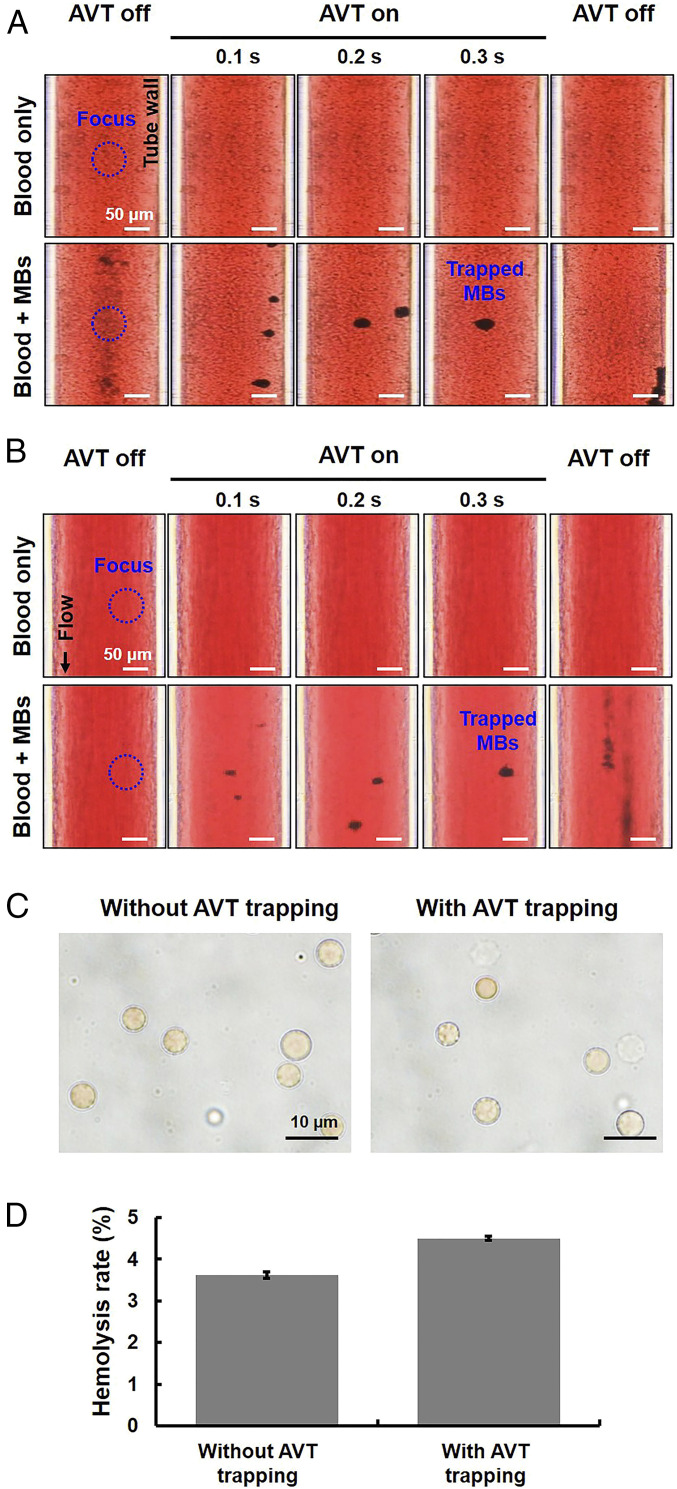
From the safety aspect, it is important to determine whether the potential-well trap produced by AVT also acts on red blood cells (RBCs) by inducing a spiral motion of RBCs during trapping, since this would probably lead to hemolytic lysis. We therefore added MBs to an RBC plasma suspension and performed AVT trapping in both static and flow (flow velocity of 2.6 cm/s) conditions. The data demonstrated that AVT trapped MBs, but not RBCs (Fig. 7 A and B; also see Movies S5 and S6), which is due to a higher acoustic impedance mismatch between MBs (0.0004 × 10⁶ rayls) and water (1.5 × 10⁶ rayls) than that between RBCs (1.6 × 10⁶ rayls) and water. In addition, Fig. 7C shows that the morphology of RBCs exhibited negligible change after the AVT trapping, corresponding to nearly less than 5% lysis rate (Fig. 7D). That showed that AVT could selectively trap MBs without having any effects on RBCs under the experimental setup.
Fig. 7.
Applying AVT trapping in the MBs–blood mixture condition. (A) Comparisons of AVT trapping in the presence of a mixture of MBs and pure blood in the static condition. Upper: group with only blood; Lower: group with an MBs–blood mixture. (B) Flow condition with a flow velocity of 2.6 cm/s. The results demonstrate that AVT trapped MBs but not RBCs. (C) Optical observation of RBCs from B via 100× oil objective to assess if the AVT-tapping MBs process would damage the morphology of RBCs. Left: without AVT trapping; Right: with AVT trapping. (D) Hemolysis testing from B to verify if AVT-tapping MBs process would lead to hemolysis of RBCs.
Application of AVT to the Mouse Circulation.
Finally, the in vivo trapping capability of AVT was investigated in the mice skin-fold dorsal window chamber model. This device allows the trapping process within blood vessels (with diameters of 10–200 μm) to be directly visualized in real time using microscopy (Fig. 8A). The initiation of MB aggregation occurred during onset of AVT (Fig. 8B; also see Movie S7). Furthermore, the MB signals within the vessels could be improved 1.7-fold. The MB cluster could be transversely moved from the center line of the vessel to the vessel endothelium by adjusting the position of either the animal or the AVT transducer (Fig. 8C; also see Movie S8). The zoomed-out view suggested that although inflowing MBs accumulated upstream of the trapping zone, they started to disperse after passing the trapping zone (Fig. 8D; also see Movie S9). This observation also suggested that AVT only could trap single MB cluster at one location at a time.
Fig. 8.
Trapping and manipulating of MBs by AVT in vivo. (A) Schematic of the experimental setup and animal model. (B) Time-lapse images and MBs signals acquired before, during, and after AVT trapping. Successful MBs trapping was observed when the AVT were activated. (C) The trapped MBs could be moved from the centerline to the vessel wall. (D) Zoomed-out view showing that MBs aggregation still occurred upstream of the trapping region during AVT initiation. Note that the MBs concentration was 4 × 10⁷ MBs per milliliter.
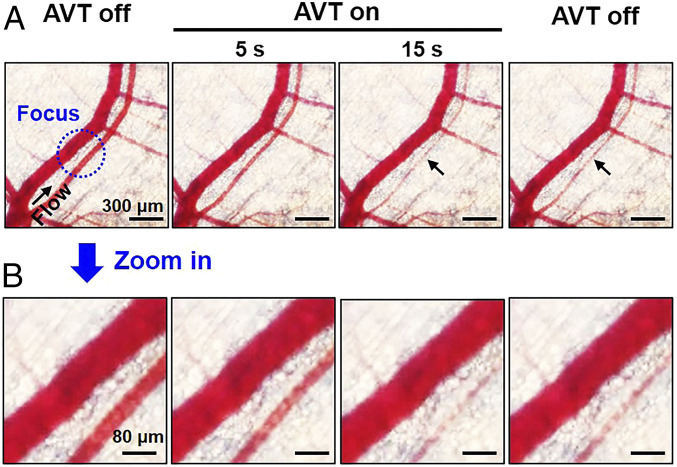
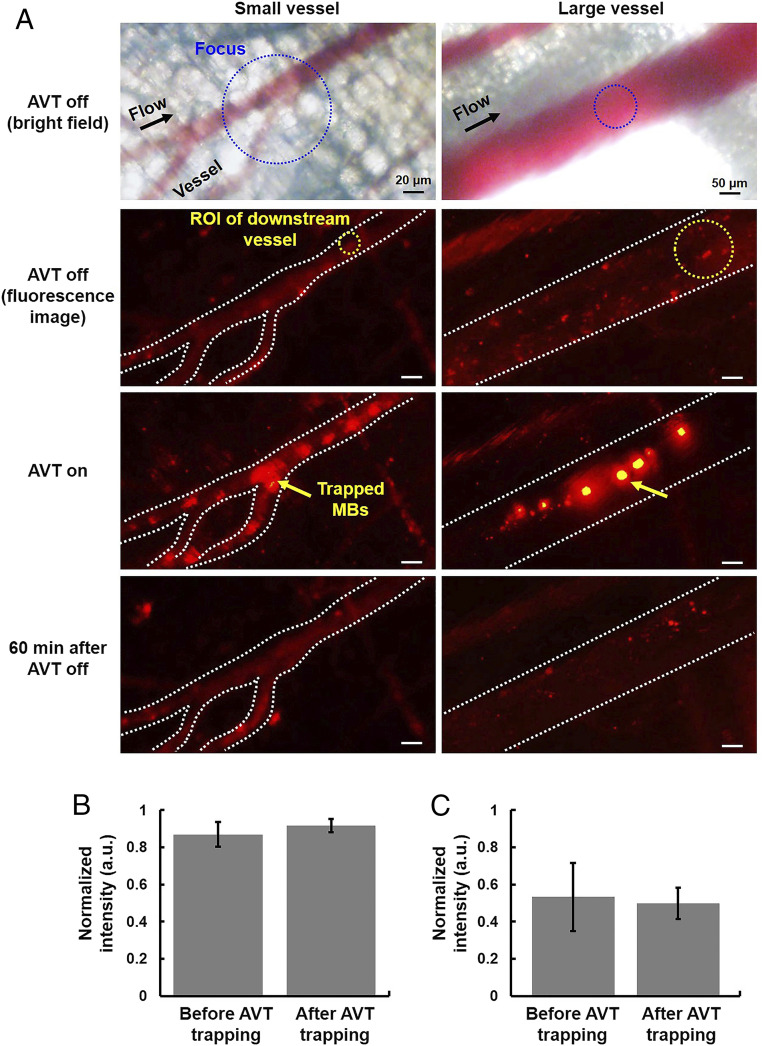
In the meantime, the bright-field imaging showed that no RBCs trapping or detectable vessel damages (i.e., capillary bleeding) occurred during or after trapping (Fig. 9 A and B). Besides, the trapped MBs did not disrupt the blood flow and induce the vasoconstriction at trapping zone (Fig. 10A). There was no significant change of fluorescence intensity at the downstream vessels between before and after trapping, indicating no blood flow occlusions (Fig. 10 B and C), suggesting that the AVT-trapped MBs did not occlude small vessels at least 20 µm of diameter. SI Appendix, Fig. S6 showed no noticeable differences in the physiological measurements (electrocardiogram, heart rate, body temperature, blood oxygen concentration) before, during, and after AVT trapping. The whole blood analysis demonstrated that there was no toxicology with the AVT with MBs group compared with healthy mice (SI Appendix, Table S2). These results conclude that AVT was safe and biologically compatible, and potentially could be used to noninvasively manipulate MBs within vessels in vivo.
Fig. 9.
Safety of AVT trapping MBs in vivo. (A) Bright-field time-lapse images showing that no trapping or detectable damage of RBCs (i.e., capillary bleeding) occurred during or after trapping. (B) Local magnification of the focal zone.
Fig. 10.
Experiment to visualize whether AVT-trapped MBs would occlude the capillaries or downstream vessels in mice. (A) The fluorescence images of small vessel and large vessel (20 and 200 µm in diameter, respectively) acquired before, during, and after AVT trapping MBs. (B and C) The corresponding fluorescence intensity before and after AVT-trapping MBs.
Discussion
In the recent years, MBs have been used as several therapeutic substances carriers for several disease applications (29–31, 46, 47). In this study, we demonstrated the feasibility of an AVT technique for the active concentration, spatial manipulation of MBs, and noninvasive trapping of circulating MBs in vivo with pulsed and nonthermal acoustic energy conditions. AVT therefore have considerable potential for improving MB-based drug delivery systems or therapies. The MBs did not coalesce after AVT trapping. No trapping or damaging of RBCs was observed during AVT initiation, confirming the high selectivity and safety of this technique. The AVT method allows MBs in circulation to be trapped so that they can be precisely moved to targeted vessel walls, thereby increasing local concentrations and potentially improving drug delivery efficiency.
Previous studies have proposed different acoustic tweezer configurations for noninvasively manipulating objects in a living body, such as single-beam acoustic tweezers and vortex beams (22, 48). Compared with single-beam acoustic tweezers, the proposed AVT can trap micrometer-size particles via low-frequency ultrasound (3 MHz) because the trapping force relies on the generation of a potential well. The particles near the axial null experience an inward force and can be trapped. Our work focused on investigating trapping performance of MBs and possible side effects in an in vivo flow condition to demonstrate the potential use as a novel drug delivery technique.
It can be concluded from the present data that the performance of AVT trapping was dominant by several parameters, including pressure, duty cycle, the number of transducer elements, and frequency. The magnitude of the trapping force should be proportional to the acoustic pressure and duty cycle, allowing tapping could be done in high-velocity condition. But, the MBs might be collapsed as acoustic pressure of AVT was too high. Increasing the number of transducer elements sharing the phase transition of 2π radians might reduce the distance between the two adjacent lobes (Fig. 2D), thereby preventing MBs from leaking out from the two lobes (minor MB leakage is evident at 80 kPa in Fig. 4B). The driving frequency of AVT would not affect the formation of the pressure gradient, but the size of the trapping region is inversely proportional to the acoustic frequency. A lower frequency improves the penetration ability, but could potentially disrupt the MBs because the mechanical index is higher. We also noticed that trapping in the flow condition might fail due to the streaming-induced drag force of the upstream MB cluster being larger than the repulsive force of the vortex, which was also found to be directly proportional to the duty cycle and acoustic pressure.
Despite that RBCs were not trapped in current system during AVT initiation, one of the most promising applications of AVT would be to trap and spatially manipulate other therapeutic cells within circulation for improving the outcome of in vivo cell therapy. We did observe the trapping of RBCs at a higher acoustic energy produced at 800 kPa and a 50% duty cycle (SI Appendix, Fig. S7). A previous study found that the acoustic impedance varied between specific cell types, being 1.73, 1.69, 1.69, 1.66–1.70, and 1.60–1.67 × 10⁶ rayls for neutrophils, lymphocytes, monocytes, BA-F3 cells, and MCF7 cells, respectively (49). This means that it should be possible to integrate AVT with current existing cell therapies.
This study demonstrated a noninvasive method for concentrating circulating MBs, but there are still several limitations that need to be addressed. First, the trapping force generated by the current device was too low to trap MBs at flow velocities higher than 3.5 cm/s. To overcome this problem, a recent study proposed an asymmetrical trapping structure for enhancing the trapping stability and retaining MBs at a flow velocity of 28 cm/s with an available mechanical index of 0.13 (50). We considered that the technique could be integrated with AVT to generate asymmetric AVT with enhanced trapping stability by expanding the four-element transducer to a two-dimensional array transducer. Second, the inflow MBs were clustered outside the trapping region during AVT initiation. The size of the repulsed MB cluster and the number of MBs it contained would be reduced by periodically turning off the AVT. Fig. 6B demonstrates that the circulating MBs could be repeatedly trapped in multiple AVT trapping trials. Third, the in vivo model in this study might not be directly relevant to the feasibility of the technique in deep tissue or transcranial applications. The phase aberrations and energy attenuation when ultrasound focusing through several types of soft tissues or skull into the targeted site would cause severe decorrelation of transmit waveforms thus compromise the performance of AVT. We designed an experiment and found that the acoustic field of AVT remained intact after penetrating a 1-cm thickness of homogeneous tissue (mice brain) (SI Appendix, Fig. S8). Furthermore, many aberration correction techniques have been proposed for ultrasound (51), potentially can be integrated with AVT for improving the efficiency of in vivo application. In the aspect of working depth, a previous study reported that the 3-MHz ultrasound could penetrate into the region with 2.6–4.0-cm depth in the human body (52). Assessing the performance of AVT in deep tissue in vivo will be the next step of this project. Fourth, the present trapping technique relied on an intact auto circulation system for replenishing MBs into the acoustic vortex-sonicated region, and this process can be affected by certain pathological states such as atherosclerosis, diabetes, and ischemia-associated disease. The noninvasive nature, deep penetration, high spatial resolution, and system flexibility of AVT are likely to increase the popularity of this technique and make it suitable for use in the next generation of ultrasound treatments.
Materials and Methods
Simulations.
According to the theory for the radiation force produced under traveling-wave conditions, the radiation force on a single MB is produced by the time-average product of the gradient in the acoustic pressure and the volume of the MB according to
where indicates the time average of MB volume, and is the spatial pressure gradient (39).
In addition to the axial radiation force parallel to the propagating direction, the presence of a lateral pressure will produce a transverse force (the lateral trapping force) that acts on the MBs. The instantaneous lateral pressure of the AVT was simulated using the Field II simulation program with the parameters listed in SI Appendix, Table S3 (53).
Assuming linear amplitude oscillations, the MB volume can be modeled with a resonant frequency below the ultrasound drive frequency:
| [1] |
where is the equilibrium MB volume, is the equilibrium MB radius, ( 1.6 mm is the width between the two pressure peaks generated by the AVT), and denote the driving frequency and the resonant frequency of the MBs, respectively, t is the time, and is the instantaneous variation of the MB radius:
| [2] |
where is the mean peak pressure amplitude, is the dimensionless damping coefficient, and is the medium density.
Thus, lateral trapping force acting on an MB in a pulsed trapping field is deduced to be
| [3] |
where indicates the pulse duty cycle.
In Vitro Experimental Setup.
In this study, observations were performed from the bottom and side views using a microscope (model IX71, Olympus Corporation) with a 40× objective lens to verify the trapping dynamics of AVT. For bottom-view observations, the ultrasound transducer was aligned with the objective in a face-to-face arrangement. A cellulose tube with an inner diameter of 200 μm (Spectrum Laboratories) was positioned at the focus between the ultrasound transducer and microscope. The MBs (1.25–40.0 × 10⁸ MBs per milliliter) were added to the tube using a syringe pump (model IM-6, Narishige Company). For side-view observations, the ultrasound transducer was placed at an angle of 90° relative to the objective. The side wall of the cellulose tube was positioned at the focus between the ultrasound transducer and microscope. The total size of the trapped MBs for each set of parameters was estimated from the acquired images using MATLAB software (The MathWorks). The fluorescence intensities of MBs before, during, and after AVT trapping were analyzed in the acquired fluorescence images using MATLAB software.
In Vivo Setup.
Four male C57BL/6JNarl mice (mean weight of 30 g and aged 6–10 wk) were provided by the National Laboratory Animal Center, New Taipei City. The animal experiments were approved by the Institutional Animal Care Committee at National Tsing Hua University (approval number 107026). Before starting the experiments, the mouse was anesthetized by intraperitoneal injection with a mixture of Rompun 2% (Bayer HealthCare) and Zoletil 50 (Virbac) (1:1, injected volume: 50 µL). The window chamber model was constructed by mounting two aluminum plates and a cover-glass window (SM100, APJ Trading) on the mouse dorsal skin (54). The MBs (concentration: 4 × 10⁷ MBs per milliliter) were infused by retroorbital injection. The fluorescence intensities of MBs before, during, and after AVT trapping (pressure: 800 kPa, duty cycle: 30%) were analyzed from the acquired fluorescence images by MATLAB software.
Statistics.
All statistical evaluations in this study were performed using ANOVA. The results are presented in the figures as mean and SE values for at least three independent measurements. The criterion for statistical significance was a probability value of P < 0.05.
Supplementary Material
Footnotes
The authors declare no competing interest.
This article is a PNAS Direct Submission.
This article contains supporting information online at https://www.pnas.org/lookup/suppl/doi:10.1073/pnas.2023188118/-/DCSupplemental.
Data Availability.
All associated protocols and materials are provided in Materials and Methods and SI Appendix. All relevant data has been uploaded at https://zenodo.org/record/4387943#.X-MEidgzYkl.
References
- 1.Wilhelm S., et al. , Analysis of nanoparticle delivery to tumours. Nat. Rev. Mater. 1, (2016). [Google Scholar]
- 2.Bae S., et al. , Doxorubicin-loaded human serum albumin nanoparticles surface-modified with TNF-related apoptosis-inducing ligand and transferrin for targeting multiple tumor types. Biomaterials 33, 1536–1546 (2012). [DOI] [PubMed] [Google Scholar]
- 3.Holzel R., Single particle characterization and manipulation by opposite field dielectrophoresis. J. Electrost. 56, 435–447 (2002). [Google Scholar]
- 4.Minerick A. R., Zhou R., Takhistov P., Chang H. C., Manipulation and characterization of red blood cells with alternating current fields in microdevices. Electrophoresis 24, 3703–3717 (2003). [DOI] [PubMed] [Google Scholar]
- 5.Altomare L., et al. , Levitation and movement of human tumor cells using a printed circuit board device based on software-controlled dielectrophoresis. Biotechnol. Bioeng. 82, 474–479 (2003). [DOI] [PubMed] [Google Scholar]
- 6.Gosse C., Croquette V., Magnetic tweezers: Micromanipulation and force measurement at the molecular level. Biophys. J. 82, 3314–3329 (2002). [DOI] [PMC free article] [PubMed] [Google Scholar]
- 7.Pethig R., Dielectrophoresis: An assessment of its potential to aid the research and practice of drug discovery and delivery. Adv. Drug Deliv. Rev. 65, 1589–1599 (2013). [DOI] [PubMed] [Google Scholar]
- 8.Owen J., Pankhurst Q., Stride E., Magnetic targeting and ultrasound mediated drug delivery: Benefits, limitations and combination. Int. J. Hyperthermia 28, 362–373 (2012). [DOI] [PubMed] [Google Scholar]
- 9.Ashkin A., Dziedzic J. M., Bjorkholm J. E., Chu S., Observation of a single-beam gradient force optical trap for dielectric particles. Opt. Lett. 11, 288–290 (1986). [DOI] [PubMed] [Google Scholar]
- 10.De Vlaminck I., Dekker C., Recent advances in magnetic tweezers. Annu. Rev. Biophys. 41, 453–472 (2012). [DOI] [PubMed] [Google Scholar]
- 11.Chen H., et al. , Improved high-force magnetic tweezers for stretching and refolding of proteins and short DNA. Biophys. J. 100, 517–523 (2011). [DOI] [PMC free article] [PubMed] [Google Scholar]
- 12.Ashkin A., Forces of a single-beam gradient laser trap on a dielectric sphere in the ray optics regime. Biophys. J. 61, 569–582 (1992). [DOI] [PMC free article] [PubMed] [Google Scholar]
- 13.Ashkin A., Optical trapping and manipulation of neutral particles using lasers. Proc. Natl. Acad. Sci. U.S.A. 94, 4853–4860 (1997). [DOI] [PMC free article] [PubMed] [Google Scholar]
- 14.Dholakia K., Spalding G., MacDonald M., Optical tweezers: The next generation. Phys. World 15, 31 (2002). [Google Scholar]
- 15.Alexiou C., et al. , Locoregional cancer treatment with magnetic drug targeting. Cancer Res. 60, 6641–6648 (2000). [PubMed] [Google Scholar]
- 16.Fan D. L., Zhu F. Q., Cammarata R. C., Chien C. L., Electric tweezers. Nano Today 6, 339–354 (2011). [DOI] [PMC free article] [PubMed] [Google Scholar]
- 17.Bernassau A. L., et al. , Controlling acoustic streaming in an ultrasonic heptagonal tweezers with application to cell manipulation. Ultrasonics 54, 268–274 (2014). [DOI] [PubMed] [Google Scholar]
- 18.Ochiai Y., Hoshi T., Rekimoto J., Pixie dust: Graphics generated by levitated and animated objects in computational acoustic-potential field. Acm T Graphic 33, 1–13 (2014). [Google Scholar]
- 19.Hertz H. M., Standing-wave acoustic trap for nonintrusive positioning of microparticles. J. Appl. Phys. 78, 4845–4849 (1995). [Google Scholar]
- 20.Lee J., Ha K., Shung K. K., A theoretical study of the feasibility of acoustical tweezers: Ray acoustics approach. J. Acoust. Soc. Am. 117, 3273–3280 (2005). [DOI] [PubMed] [Google Scholar]
- 21.Lee J., et al. , Single beam acoustic trapping. Appl. Phys. Lett. 95, 73701 (2009). [DOI] [PMC free article] [PubMed] [Google Scholar]
- 22.Li Y., Lee C., Chen R., Zhou Q., Shung K. K., A feasibility study of in vivo applications of single beam acoustic tweezers. Appl. Phys. Lett. 105, 173701 (2014). [DOI] [PMC free article] [PubMed] [Google Scholar]
- 23.Liu J., et al. , Endothelial adhesion of targeted microbubbles in both small and great vessels using ultrasound radiation force. Mol. Imaging 11, 58–66 (2012). [PubMed] [Google Scholar]
- 24.Rychak J. J., Klibanov A. L., Hossack J., Acoustic radiation force enhances adhesion of microbubbles targeted to P-selectin. Ultrason, 1110–1113 (2004). [Google Scholar]
- 25.Dayton P., Klibanov A., Brandenburger G., Ferrara K., Acoustic radiation force in vivo: A mechanism to assist targeting of microbubbles. Ultrasound Med. Biol. 25, 1195–1201 (1999). [DOI] [PubMed] [Google Scholar]
- 26.Kang S. T., Yeh C. K., Trapping of a Mie sphere by acoustic pulses: Effects of pulse length. IEEE Trans. Ultrason. Ferroelectr. Freq. Control 60, 1487–1497 (2013). [DOI] [PubMed] [Google Scholar]
- 27.Kang S. T., Yeh C. K., Potential-well model in acoustic tweezers. IEEE Trans. Ultrason. Ferroelectr. Freq. Control 57, 1451–1459 (2010). [DOI] [PubMed] [Google Scholar]
- 28.Hynynen K., McDannold N., Vykhodtseva N., Jolesz F. A., Noninvasive MR imaging-guided focal opening of the blood-brain barrier in rabbits. Radiology 220, 640–646 (2001). [DOI] [PubMed] [Google Scholar]
- 29.Ting C. Y., et al. , Concurrent blood-brain barrier opening and local drug delivery using drug-carrying microbubbles and focused ultrasound for brain glioma treatment. Biomaterials 33, 704–712 (2012). [DOI] [PubMed] [Google Scholar]
- 30.Lentacker I., et al. , Ultrasound-responsive polymer-coated microbubbles that bind and protect DNA. Langmuir 22, 7273–7278 (2006). [DOI] [PubMed] [Google Scholar]
- 31.Chang E. L., et al. , Angiogenesis-targeting microbubbles combined with ultrasound-mediated gene therapy in brain tumors. J. Control. Release 255, 164–175 (2017). [DOI] [PubMed] [Google Scholar]
- 32.Hefner B. T., Marston P. L., An acoustical helicoidal wave transducer with applications for the alignment of ultrasonic and underwater systems. J. Acoust. Soc. Am. 106, 3313–3316 (1999). [Google Scholar]
- 33.Szabo T. L., Diagnostic Ultrasound Imaging: Inside Out (Biomedical Engineering, Elsevier Academic Press, Amsterdam, 2004), pp. xxii, 549 p. [Google Scholar]
- 34.Baresch D., Thomas J. L., Marchiano R., Spherical vortex beams of high radial degree for enhanced single-beam tweezers. J. Appl. Phys. 113, (2013). [Google Scholar]
- 35.Hong Z., Zhang J., Drinkwater B. W., Observation of orbital angular momentum transfer from Bessel-shaped acoustic vortices to diphasic liquid-microparticle mixtures. Phys. Rev. Lett. 114, 214301 (2015). [DOI] [PubMed] [Google Scholar]
- 36.Rychak J. J., Klibanov A. L., Hossack J. A., Acoustic radiation force enhances targeted delivery of ultrasound contrast microbubbles: In vitro verification. IEEE Trans. Ultrason. Ferroelectr. Freq. Control 52, 421–433 (2005). [DOI] [PubMed] [Google Scholar]
- 37.Treat L. H., et al. , Targeted delivery of doxorubicin to the rat brain at therapeutic levels using MRI-guided focused ultrasound. Int. J. Cancer 121, 901–907 (2007). [DOI] [PubMed] [Google Scholar]
- 38.Yang F. Y., et al. , Quantitative evaluation of focused ultrasound with a contrast agent on blood-brain barrier disruption. Ultrasound Med. Biol. 33, 1421–1427 (2007). [DOI] [PubMed] [Google Scholar]
- 39.Dayton P. A., et al. , A preliminary evaluation of the effects of primary and secondary radiation forces on acoustic contrast agents. IEEE T Ultrason Ferr 44, 1264–1277 (1997). [Google Scholar]
- 40.Langille S. E., Particulate matter in injectable drug products. PDA J. Pharm. Sci. Technol. 67, 186–200 (2013). [DOI] [PubMed] [Google Scholar]
- 41.Zhao Y. Z., Du L. N., Lu C. T., Jin Y. G., Ge S. P., Potential and problems in ultrasound-responsive drug delivery systems. Int. J. Nanomedicine 8, 1621–1633 (2013). [DOI] [PMC free article] [PubMed] [Google Scholar]
- 42.Jakobsen J. A., Oyen R., Thomsen H. S., Morcos S. K.; Members of Contrast Media Safety Committee of European Society of Urogenital Radiology (ESUR) , Safety of ultrasound contrast agents. Eur. Radiol. 15, 941–945 (2005). [DOI] [PubMed] [Google Scholar]
- 43.Shortencarier M. J., et al. , A method for radiation-force localized drug delivery using gas-filled lipospheres. IEEE Trans. Ultrason. Ferroelectr. Freq. Control 51, 822–831 (2004). [DOI] [PubMed] [Google Scholar]
- 44.Pappano A. J., Wier W. G., Levy M. N., Cardiovascular Physiology (Mosby Physiology Monograph Series, Elsevier/Mosby, Philadelphia, PA, ed. 10, 2013), pp. xii, 292 p. [Google Scholar]
- 45.Tortora G. J., Derrickson B., Principles of Anatomy & Physiology (Wiley, Hoboken, NJ, ed. 13, 2012). [Google Scholar]
- 46.Yang H., et al. , The effects of ultrasound-targeted microbubble destruction (UTMD) carrying IL-8 monoclonal antibody on the inflammatory responses and stability of atherosclerotic plaques. Biomed. Pharmacother. 118, 109161 (2019). [DOI] [PubMed] [Google Scholar]
- 47.Un K., et al. , Development of an ultrasound-responsive and mannose-modified gene carrier for DNA vaccine therapy. Biomaterials 31, 7813–7826 (2010). [DOI] [PubMed] [Google Scholar]
- 48.Ghanem M. A., et al. , Noninvasive acoustic manipulation of objects in a living body. Proc. Natl. Acad. Sci. U.S.A. 117, 16848–16855 (2020). [DOI] [PMC free article] [PubMed] [Google Scholar]
- 49.Augustsson P., Karlsen J. T., Su H. W., Bruus H., Voldman J., Iso-acoustic focusing of cells for size-insensitive acousto-mechanical phenotyping. Nat. Commun. 7, 11556 (2016). [DOI] [PMC free article] [PubMed] [Google Scholar]
- 50.Raiton B., et al. , The capture of flowing microbubbles with an ultrasonic tap using acoustic radiation force. Appl. Phys. Lett. 101, (2012). [Google Scholar]
- 51.Kyriakou A., et al. , A review of numerical and experimental compensation techniques for skull-induced phase aberrations in transcranial focused ultrasound. Int. J. Hyperthermia 30, 36–46 (2014). [DOI] [PubMed] [Google Scholar]
- 52.Culjat M. O., Goldenberg D., Tewari P., Singh R. S., A review of tissue substitutes for ultrasound imaging. Ultrasound Med. Biol. 36, 861–873 (2010). [DOI] [PubMed] [Google Scholar]
- 53.Jensen J. A., Svendsen N. B., Calculation of pressure fields from arbitrarily shaped, apodized, and excited ultrasound transducers. IEEE Trans. Ultrason. Ferroelectr. Freq. Control 39, 262–267 (1992). [DOI] [PubMed] [Google Scholar]
- 54.Papenfuss H. D., Gross J. F., Intaglietta M., Treese F. A., A transparent access chamber for the rat dorsal skin fold. Microvasc. Res. 18, 311–318 (1979). [DOI] [PubMed] [Google Scholar]
Associated Data
This section collects any data citations, data availability statements, or supplementary materials included in this article.
Supplementary Materials
Data Availability Statement
All associated protocols and materials are provided in Materials and Methods and SI Appendix. All relevant data has been uploaded at https://zenodo.org/record/4387943#.X-MEidgzYkl.


