Fig. 3.
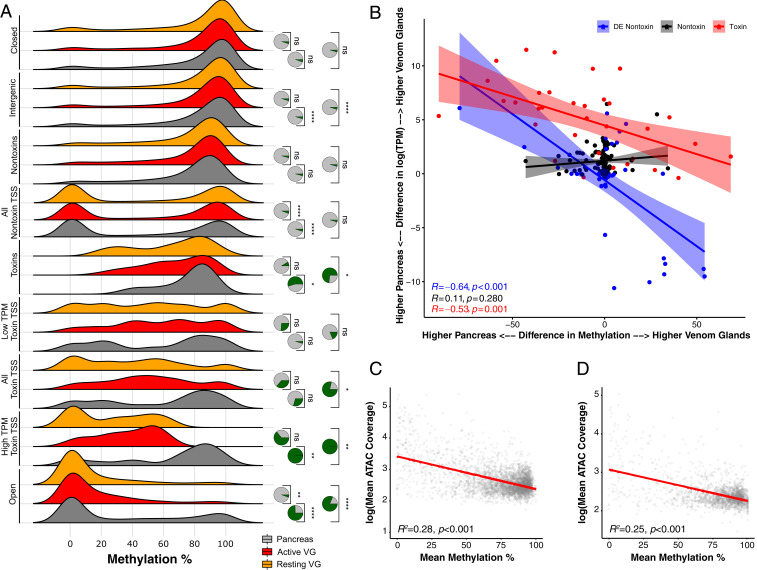
Methylation levels and chromatin accessibility jointly regulate gene expression in the venom glands of the Tiger Rattlesnake. (A) Distributions of methylation levels for pancreas, active venom glands (VG), and resting VGs across venom-gland-specific chromatin-accessible regions (Open), high-expression toxin-gene TSSs (High TPM Toxin TSS), all toxin-gene TSSs, low-expression (Low TPM) toxin-gene TSSs, entire toxin-genic regions including introns (Toxin), all nontoxin-gene TSSs, entire nontoxin-genic regions including introns (Nontoxin), intergenic regions, and inaccessible chromatin regions (Closed). TSS regions included bp around the estimated start site. High TPM toxins represent the 20 most highly expressed toxins (TPM > 1,000). Low TPM toxins represent the 32 transcripts with TPM < 1,000. Nontoxin genes represent genes actively expressed in the VGs that do not produce toxic proteins. Statistical significance was assessed by using t tests. Pie charts represent the proportion of 10,000 bootstrapped t tests that were significant ( < 0.05) after subsampling; green represents significant tests, and gray represents nonsignificant tests. (B) Difference in methylation level for TSS ( bp) across pancreas and VGs significantly predicts expression differences across the same tissues. Each point represents an individual transcript. Blue points represent nontoxins that were significantly differentially expressed (DE) across VGs and pancreas (mean TPM > 300; Padj < 0.01). Black points represent nontoxins that were not significantly DE across VGs and pancreas (mean TPM > 300; Padj > 0.1). Red points represent toxins. The y axis shows the difference in expression between VGs and pancreas; positive values represent transcripts more highly expressed in the VGs, whereas negative values represent transcripts more highly expressed in the pancreas. The x axis shows the difference in methylation level between VGs and pancreas; positive values represent transcripts more highly methylated in the VGs, whereas negative values represent transcripts more highly methylated in the pancreas. Overall, transcripts that exhibit DE across pancreas and VGs also exhibit differences in methylation levels; transcripts that are more highly expressed in the VGs have reduced methylation levels in the VG and vice versa. (C and D) Chromatin accessibility and methylation level are significantly negatively correlated across the (C) and SVMP (D) genomic regions. The y axis represents log-transformed ATAC-seq mean coverage estimates across 2-kb bins for all three VGs. The x axis represents mean methylation percentage across 2-kb bins for both VGs sequenced.

