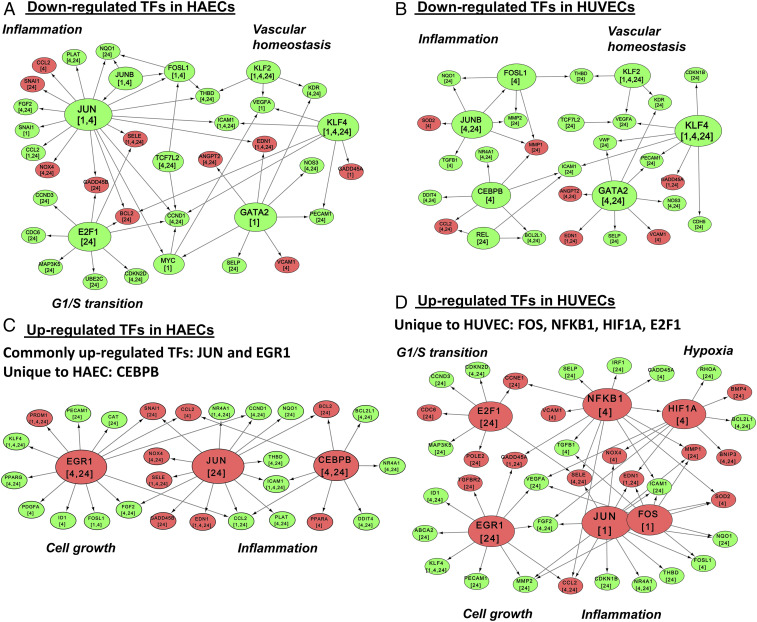
Fig. 2.
Comparison of transcriptional regulatory networks under OS and PS conditions. Shown are important targets of down-regulated TFs in HAECs (A) and HUVECs (B), and important targets of up-regulated TFs in HAECs (C) and HUVECs (D). The TF target relationships were obtained from the TRANSFAC database. DE TFs were connected to their DE targets when the target was DE at the same or a later time point. The green and red colors for the TF nodes indicate down-regulation and up-regulation, respectively. The same color coding is used for the target nodes.

