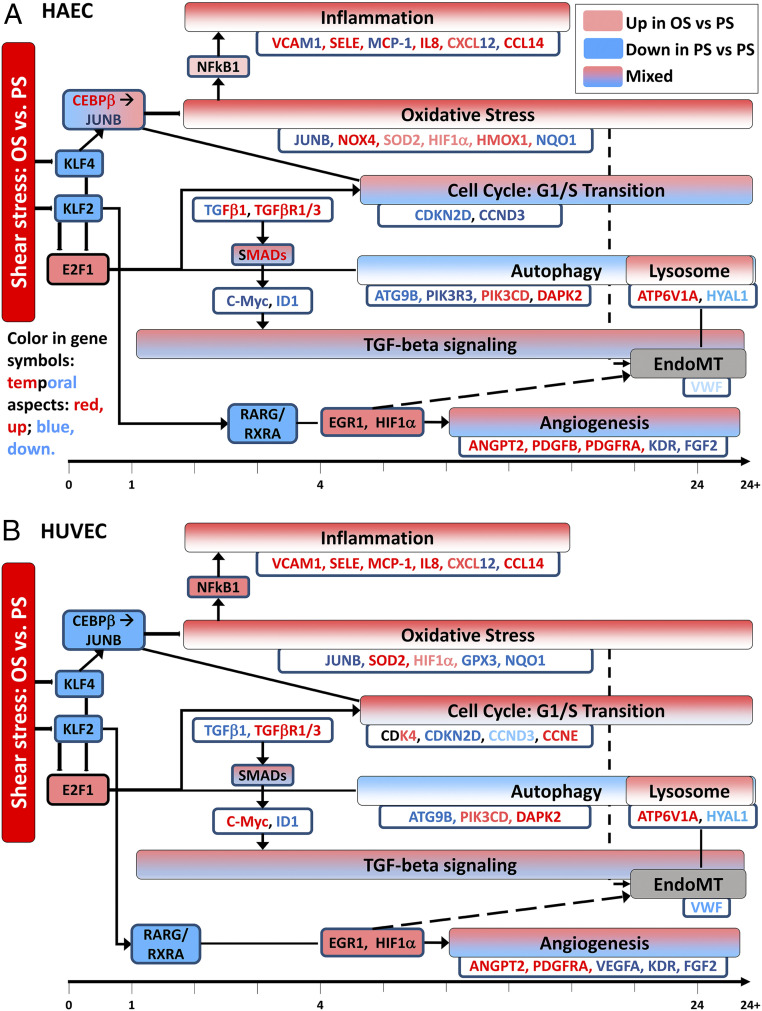
Fig. 5.
Temporal map of changes in EC function-relevant pathways in HAECs (A) and HUVECs (B). Color-filled boxes represent pathways. Pathways and genes in red are up-regulated (up) by OS vs. PS, while those in blue are down-regulated (down) by OS vs. PS. Some pathways such as TGF-β signaling pathway and angiogenesis are shown in “mixed” color (gradient) due to mixed response (both up- and down-regulated). Such mixed response is generally observed across the time course. For the cell cycle pathway, CCND3 is down-regulated strongly in HAECs, but only moderately in HUVECs. CDK4 is moderately up-regulated only in HUVECs. Inflammation-related processes and oxidative stress response pathway show overall similar response in both cell types, although there are some temporal differences in specific genes. NFκB is slightly and moderately up-regulated in HAECs and HUVECs, respectively, and JUNB and NQO1 are down-regulated in both cell types. SOD2, one of the key genes related to oxidative stress, is up-regulated significantly in HUVECs, but only slightly in HAECs, although the response persists across time. HIF1α is slightly up-regulated in both cell types. While the angiogenesis pathway and its genes show mixed responses in both cell types and the responses are broadly similar, the changes appear earlier in HAECs than HUVECs. Autophagy and lysosome pathways are overall down- and up-regulated, respectively, in both cell types, although there are minor differences in the differential expression of several genes. Angiogenesis exhibits mixed response in both cell types.

