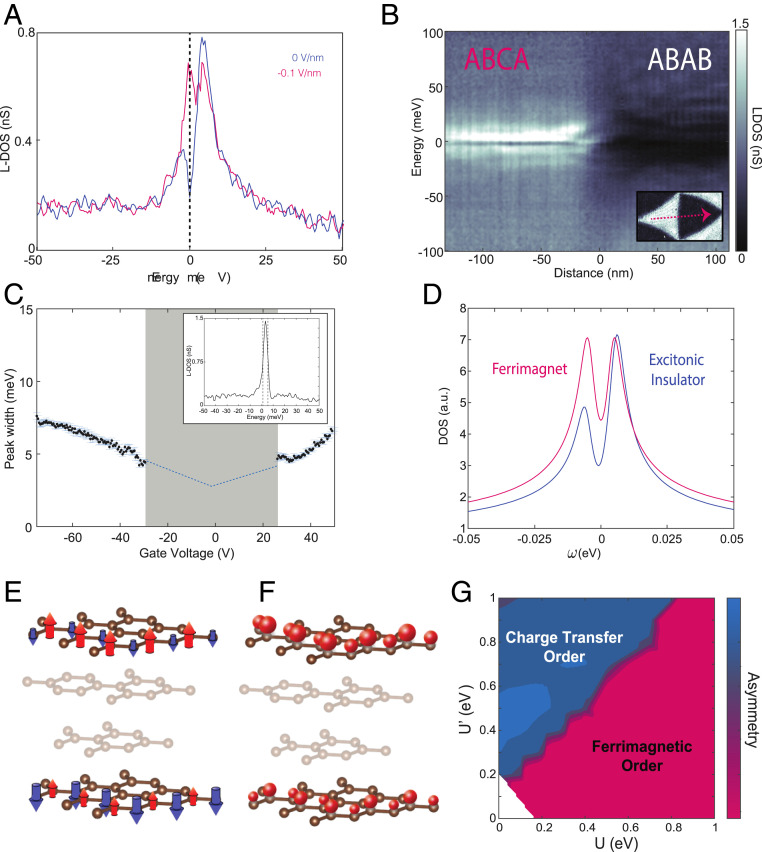
Fig. 3.
Electronic correlations in ABCA graphene. (A) Two STS LDOS curves at small displacement fields (blue at neutrality and ∼0 V/nm and magenta at −0.1 V/nm) where in a single-particle picture there should be no gap. The van Hove singularity splits and shows a correlated gap of 9.5 and 4.5 meV, respectively. (B) STS LDOS linecut at charge neutrality across an ABCA and an ABAB domain. (C) ABCA van Hove singularity half-width as a function of gate voltage. The shaded region in gray is excluded as the van Hove singularity half-width cannot be cleanly extracted due to splitting. (Inset) An STS spectrum with the peak still far from the Fermi level, exhibiting a 4-meV half-width. STS measurements in A–C were taken at setpoints of 300 mV and 200 pA with a lock-in oscillation of 0.5 mV. (D) Tight-binding mean-field DOS for ferrimagnetic and charge-transfer excitonic insulator ordered states. (E and F) Visual representation of the two ordered states in ABCA graphene. The mostly irrelevant middle layers are shaded. Ferrimagnetic spin order (E) and charge-transfer insulating order (F) are shown by arrows pointing up or down as well as big or small spheres, respectively (shown on select sites only). (G) Asymmetry of peaks in mean-field tight-binding model as a function of U, intralayer, and U′, top–bottom layer interactions. The most likely ordered state in each region is labeled.

