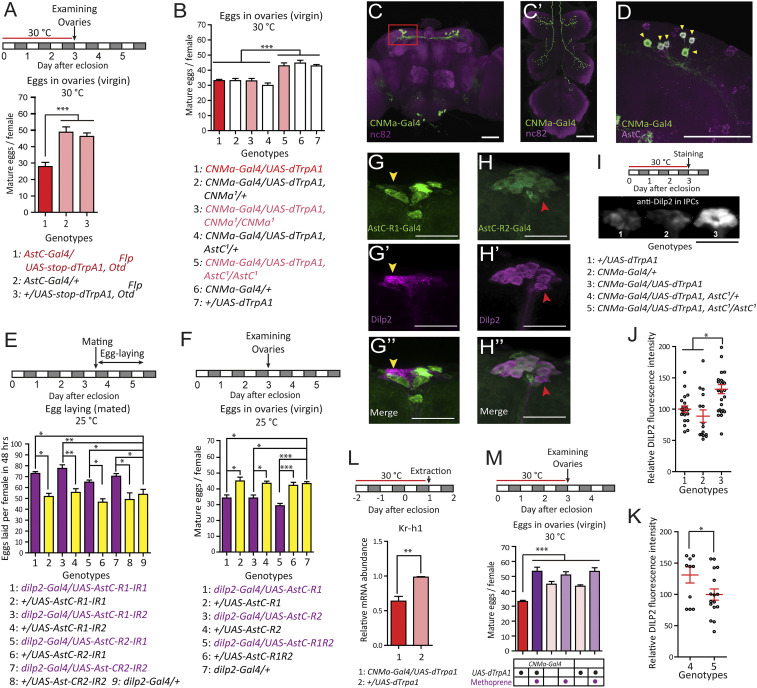
Fig. 3.
AstC from AstC-DN1p inhibits JH-dependent oogenesis progression via IPCs. (A) Above, protocol for measuring virgin female egg production used in A and B. (Lower) number of mature eggs per virgin female (n = 40 to 60) of the indicated genotype kept 3 d posteclosion at 30 °C. The means ± SEM of the data are shown (A, B, E, F, and J–M). One-way ANOVA followed by Tukey’s test for multiple comparisons; *P < 0.05; **P < 0.005; ***P < 0.001 for comparisons between indicated genotypes or groups (A, B, E, F, and M). (B) Number of mature eggs per virgin female (n = 30 to 40) of the indicated genotype kept 3 d posteclosion at 30 °C. (C) The brain (C) and VNC (C′) of a 4-d-old virgin female of the CNMa-Gal4/UAS-mCD8-EGFP genotype stained with the nc82 (magenta) and anti-GFP (green) antibodies. (Scale bars, 50 μm.) (D) Dorso-lateral area of the brain indicated by the red box in C from a CNMa-Gal4/UAS-mCD8-EGFP female CNS stained with anti-AstC (magenta) and anti-GFP (green) antibodies. Yellow arrowheads indicate six cells positive for both anti-AstC and anti-GFP in one hemisphere of the brain. (Scale bar, 50 μm.) (E, Upper) Behavioral protocol for measuring mated female egg laying. (Lower) Number of eggs laid per female (n = 40 to 60) of the indicated genotype for 48 h after mating at 25 °C. (F, Upper) Protocol for measuring virgin female egg production. (Lower) Number of mature eggs per virgin female (n = 40 to 60) of the indicated genotype kept 3 d posteclosion at 25 °C. (G) IPCs of a 4-d-old virgin AstC-R1-Gal4/UAS-mCD8-EGFP female stained with anti-Dilp2 (magenta) and anti-GFP (green) antibodies. (Scale bars, 50 μm.) This specific preparation has one IPC that is positive for anti-GFP (yellow arrowhead). (H) IPCs of a 4-d-old virgin AstC-R2-Gal4/UAS-mCD8-EGFP female stained with anti-Dilp2 (magenta) and anti-GFP (green) antibodies. (Scale bars, 50 μm.) Usually, 13 of 14 anti-Dilp2-positive IPCs are positive for anti-GFP. A red arrowhead indicates one IPC that lacks anti-GFP labeling. (I, Upper) Protocol for Dilp2 accumulation experiment in IPCs. (Lower) Images of IPCs from virgin females of the indicated genotype and condition stained with an anti-Dilp2 antibody. (Scale bar, 100 μm.) (J and K) Relative fluorescence intensity of anti-Dilp2 staining of IPCs from females of the indicated genotype in I, kept for 3 d posteclosion at 30 °C. Each circle indicates a relative fluorescence intensity from all IPC somas of a brain. The relative fluorescence intensity is calculated by setting the average of (genotype-1 brains in J and genotype-5 brains in K) as 100%. Unpaired t test; *P < 0.05 for comparisons between indicated genotypes. (L, Upper) Protocol for fly preparation for quantitative RT-PCR. (Lower) Kr-h1 transcript levels in 1-d-old adult females of the indicated genotypes kept for 3 d at 30 °C. Unpaired t test; **P < 0.005. (M, Upper) Protocol for measuring virgin female egg production. (Lower) Number of mature eggs per virgin female (n = 20 to 40) of the indicated genotype kept for 3 d posteclosion at 30 °C. Magenta circle indicates methoprene treatment.

