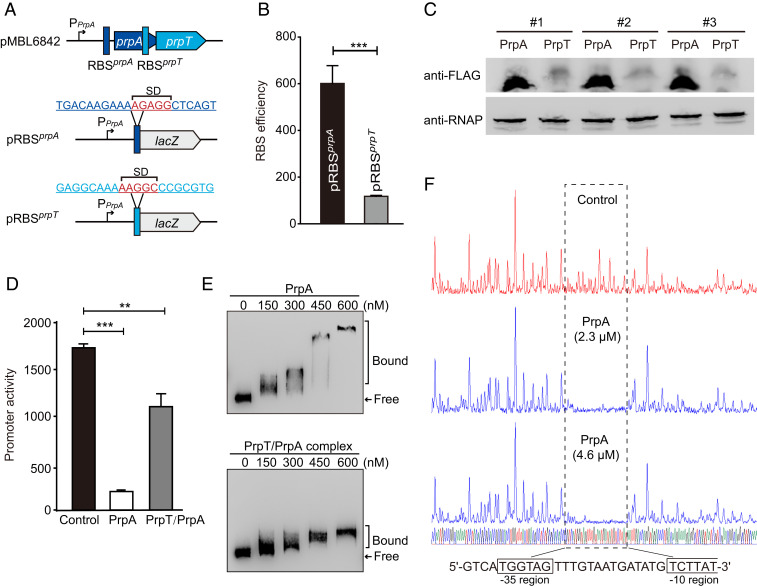
Fig. 3.
PrpA and PrpT/PrpA bind to the prpA-prpT operon. (A) Schematic of the prpA-prpT operon. The Shine–Dalgano sequences of prpA and prpT are highlighted in red. (B) Comparison of the RBS activities is shown using the two lacZ reporter plasmids, pRBSprpA or pRBSprpT in A. (C) Western blot showing that the production of PrpA exceeded PrpT (n = 3); the results were obtained by using FLAG-tagged PrpA (10.5 kDa) or PrpT (12.3 kDa). RNAP was used as a control. (D) The promoter activity was measured by overexpressing PrpA or PrpT/PrpA using pRBSprpA. (E) EMSA results showed that PrpA and PrpA/PrpT complex bound and shifted the promoter in a dose-dependent manner. (F) The binding site of PrpA is analyzed by the DNase I footprinting assay using two different concentrations of PrpA. The 30-bp binding site of PrpA covers the −35 and partial −10 regions of the promoter.

