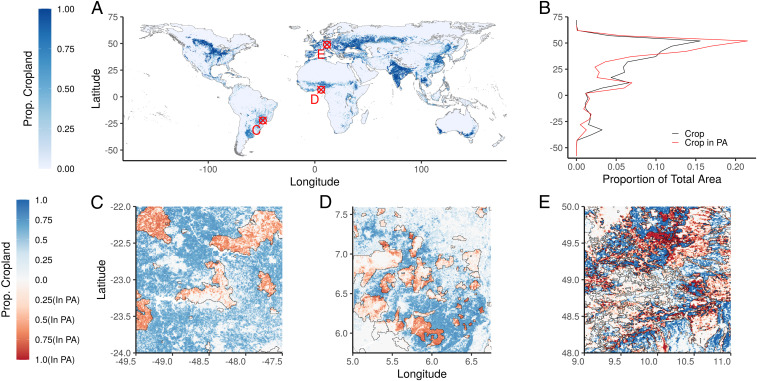
Fig. 1.
(A) Map showing global map of cropland. Proportion of pixel in cropland from 0 (gray) to 1 (blue). (B) Plot showing proportion of total cropland (black) and proportion of cropland in protected areas (red) by latitude. Insets show greater details of cropland patterns from global map (marked in red in A) in Brazil (C), Nigeria (D), and Germany (E). Proportion of pixel in cropland from 1 in protected area (red) to 0 (gray) to 1 outside protected area (blue).

