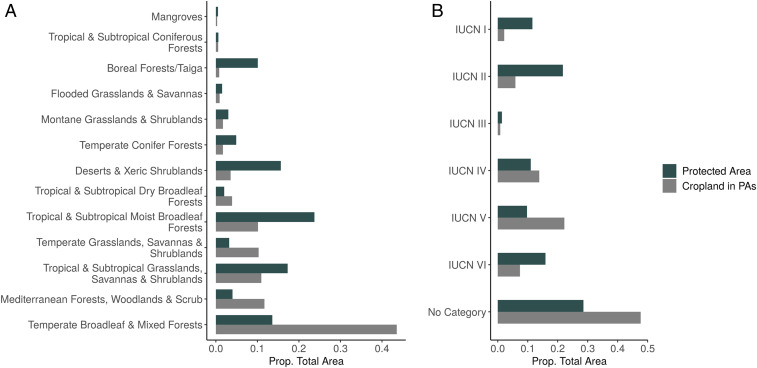
Fig. 2.
Cropland in protected areas by biome and by IUCN protected area management category. (A) Proportion of total protected area (dark gray) and total cropland in protected area (light gray) by biome. Biomes are ordered in increasing proportions of cropland in protected area. (B) Proportion of total protected area (dark gray) and total cropland in protected area (light gray) by IUCN protected area management category.

