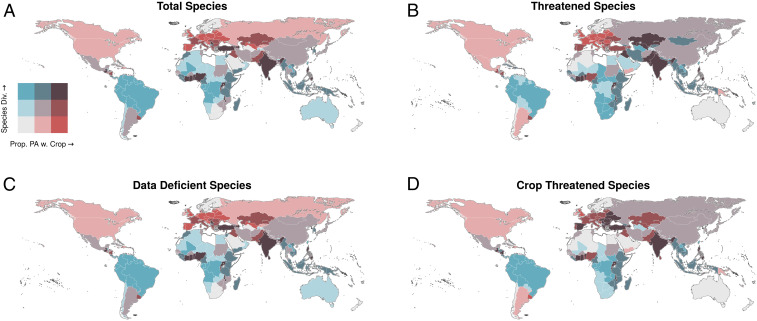
Fig. 3.
Bivariate maps of proportion of cropland in protected area and biodiversity in protected areas by country. (A) Total terrestrial species diversity. (B) Threatened species diversity. (C) Data deficient species diversity. (D) Crop threatened species diversity. White areas represent missing data.

