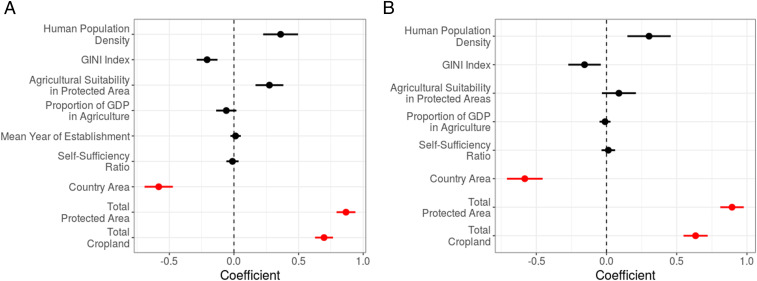
Fig. 4.
Standardized model averaged regression coefficients predicting cropland area with error bars showing adjusted SE for global model (A) and countries monitored by the Global Hunger Index (B). Nonstandardized base model coefficients shown in red, where the null expectation is that these will to be close to −1 for country area and + 1 for total protected area and total cropland.

