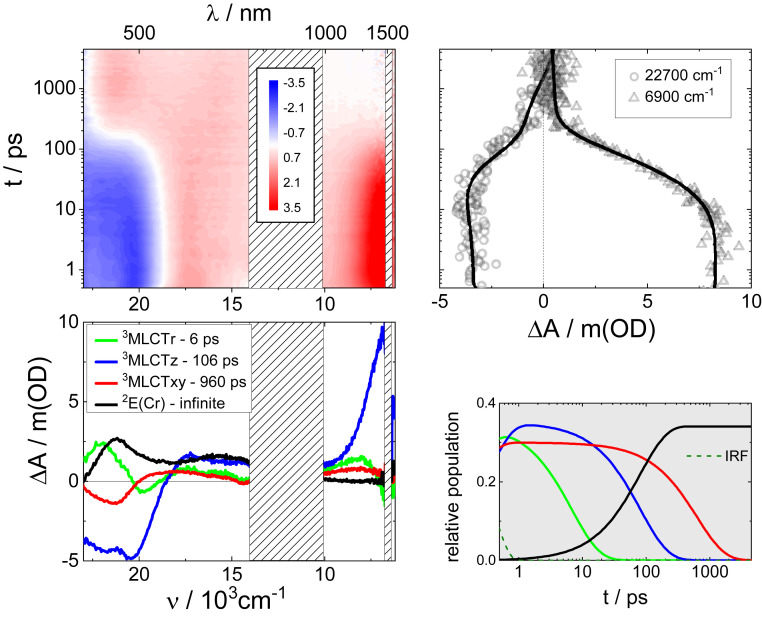
Fig. 3.
Femtosecond transient absorption spectroscopy. Differential absorption 3D map obtained from fsTAS with 25,800 cm−1 (387 nm) excitation of RuRuCr in DMSO at room temperature (Upper Left). Species associated differential spectra of 3MLCTr, 3MLCTz, 3MLCTxy, and 2E(Cr) (Bottom Left). Differential absorption kinetic traces at 6,900 and 22,700 cm−1 (Upper Right) and relative populations of 3MLCTr, 3MLCTz, 3MLCTxy, and 2E(Cr) (Bottom Right).

