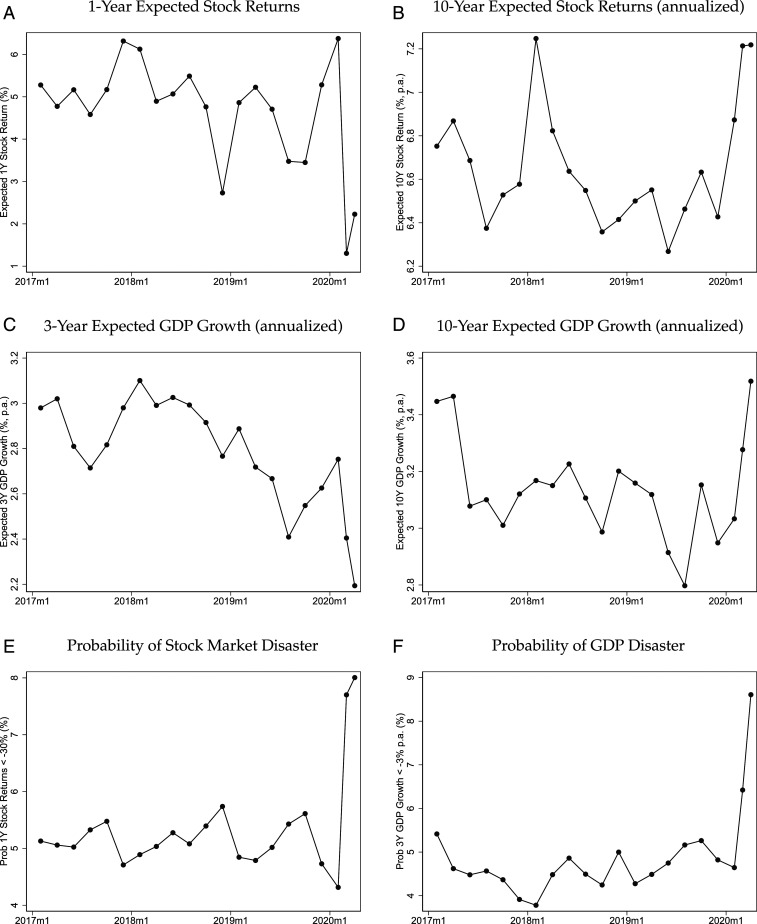
Fig. 2.
Average responses to GMSU-Vanguard survey. Figure shows average beliefs across all respondents in each wave of the GMSU-Vanguard survey. (A) The 1-y expected stock market return, (B) the 10-y expected stock market return (annualized), (C) the expected real GDP annual growth over the next 3 y, (D) the expected real GDP annual growth over the next 10 y, (E) the probability of stock market returns being lower than −30% over the next year, and (F) the probability of GDP growth being less than −3% on average over the next 3 y.

