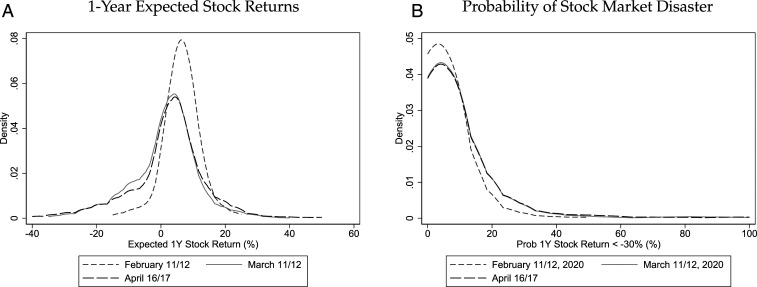
Fig. 3.
Distribution of responses to the GMSU-Vanguard survey. Figure shows kernel density distributions over responses on the February 11–12, 2020, the March 11–12, 2020, and the April 16–17, 2020 waves of the GMSU-Vanguard survey. (A) The distribution of beliefs about 1-y expected stock returns, and (B) the distribution of beliefs about the probability of a stock market decline of more than 30% over the coming 12 mo.

