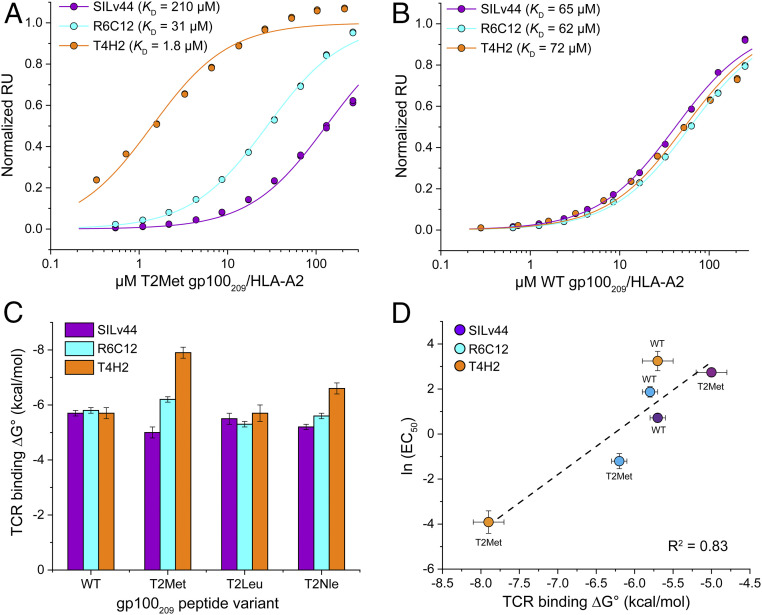
Fig. 1.
The SILv44, R6C12, and T4H2 TCRs sense anchor modification in the gp100209 peptide differently. (A) SPR titrations for the three TCRs binding the T2Met/HLA-A2 complex. The TCRs show an ∼120-fold range in affinity, with T4H2 binding strongest and SILv44 TCR weakest. Data points show representative titrations with duplicate injections. To aid in presentation, data points and fitted curves were normalized to maximum response values determined from the global analysis of multiple datasets as described in Methods. The color scheme for the TCRs is maintained throughout the figure. (B) As in A but binding to the WT peptide/HLA-A2 complex. The TCRs bind with almost identical affinities. (C) Free energy changes (ΔG°) for the TCRs binding the WT, T2Met, T2Leu, and T2Nle peptide/HLA-A2 complexes. Values and error bars are from SI Appendix, Table S2, propagated from the average and SDs of the KD values. (D) EC50 values from the functional titrations in SI Appendix, Fig. S3 are well correlated with the binding free energies. Error bars are from SI Appendix, Table S2 (ΔG°) or propagated from the errors in EC50 measurements in SI Appendix, Fig. S3.

