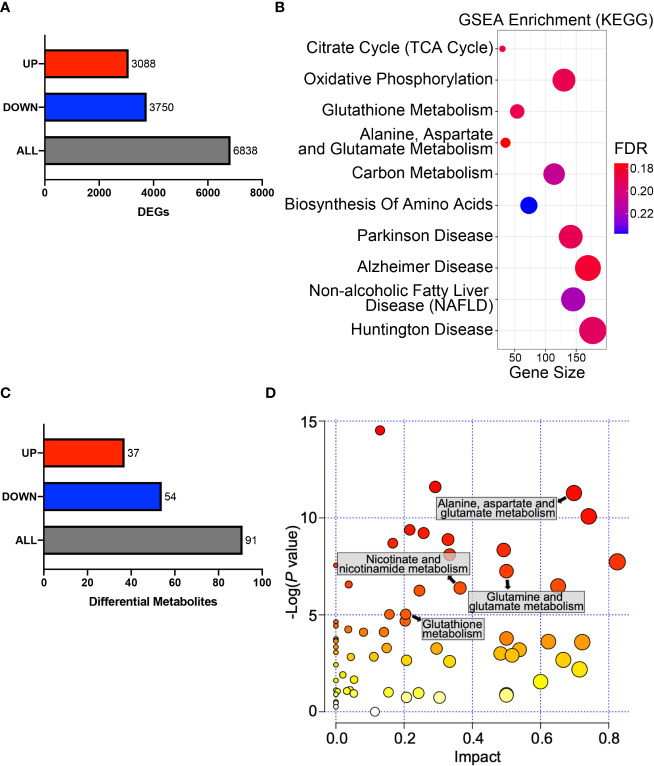
Figure 5.
HPDL reprograms metabolic profiles in PDAC cells. (A) DEGs in the gene expression profiling results of HPDL OE and control cells. Threshold was set as follows: p-adj<0.05, |log2(OE/Vector) |>0. (B) GSEA in the gene expression profiling results of HPDL OE and control cells. Gene size refers to the count of genes enriched in certain pathways. FDR, false discovery rate. The GSEA was performed based on KEGG database (https://www.genome.jp/kegg/). (C) Differentially metabolites in metabolomic profiling results of HPDL OE and control cells. Threshold was set as follows: p<0.05, OE/Vector>1.2 or < 0.83. (D) MSEA in metabolomic profiling results of HPDL OE and control cells. Different metabolic pathways were plotted with p-value and impact. The MSEA was performed based on KEGG database (https://www.genome.jp/kegg/).

