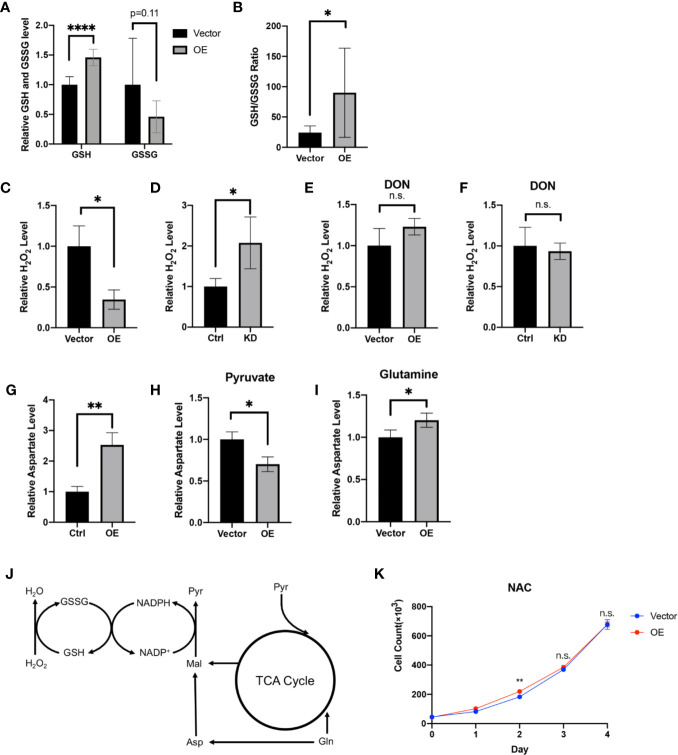
Figure 6.
HPDL regulates redox balance via a glutamine-dependent antioxidative pathway. (A, B) Relative GSH, GSSG level (A) and GSH/GSSG ratio (B) in metabolome results of HPDL OE and control cells. (C, D) Relative H2O2 level of HPDL OE (C) and KD (D) cells with theirs paired control cells. (E, F) Relative H2O2 level of HPDL OE (E) and KD (F) cells with theirs paired control cells in the presence of glutamine antagonist DON (5 mM). (G) Relative aspartate level of HPDL OE and control cells. (H, I) Relative aspartate level of HPDL OE and control cells in different culture conditions. Cells were cultured in medium supplemented with 5 mM pyruvate (H) or 4 mM glutamine (I) as the only carbon source for 12 h and subsequently the cellular aspartate was measured. (J) Schematic metabolic pathway of cellular antioxidative process. This diagram was prepared based on a previous work of Son (18). Pyr, pyruvate. Gln, Glutamine. Asp, aspartate. Mal, malate. (K) Cell proliferation of HPDL OE and control cells with NAC treatment. Cells were cultured in medium supplemented with 5 mM NAC. (*P < 0.05. **P < 0.01. ****P < 0.0001. n.s., no significance.)

