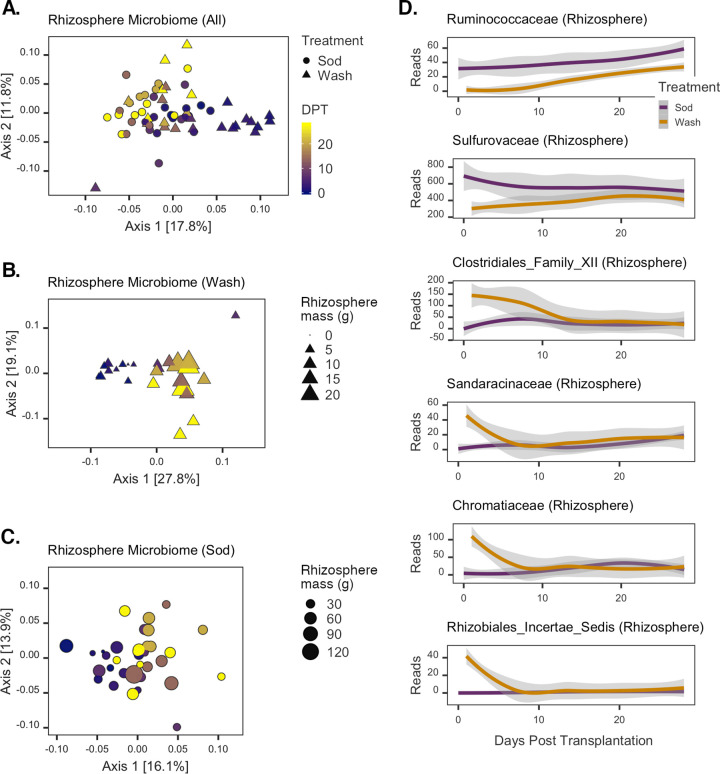
FIG 4.
Changes in rhizosphere microbial communities posttransplantation. (A to C) PCoAs of all rhizosphere (A), washed rhizosphere (B), and sod transplant rhizosphere (C) communities. The color gradient represents the day of sample collection (DPT), and symbols represent the treatment assignment for each sample. Symbol sizes in panels B and C are scaled to the grams of rhizosphere sediment collected from each corresponding sampled plant. (D) Rhizosphere ASVs with significant time-treatment interaction effects. LOESS was applied to the sequence counts for each taxon; shaded areas represent the 95% confidence intervals of the estimates. Colors designate each treatment group.

