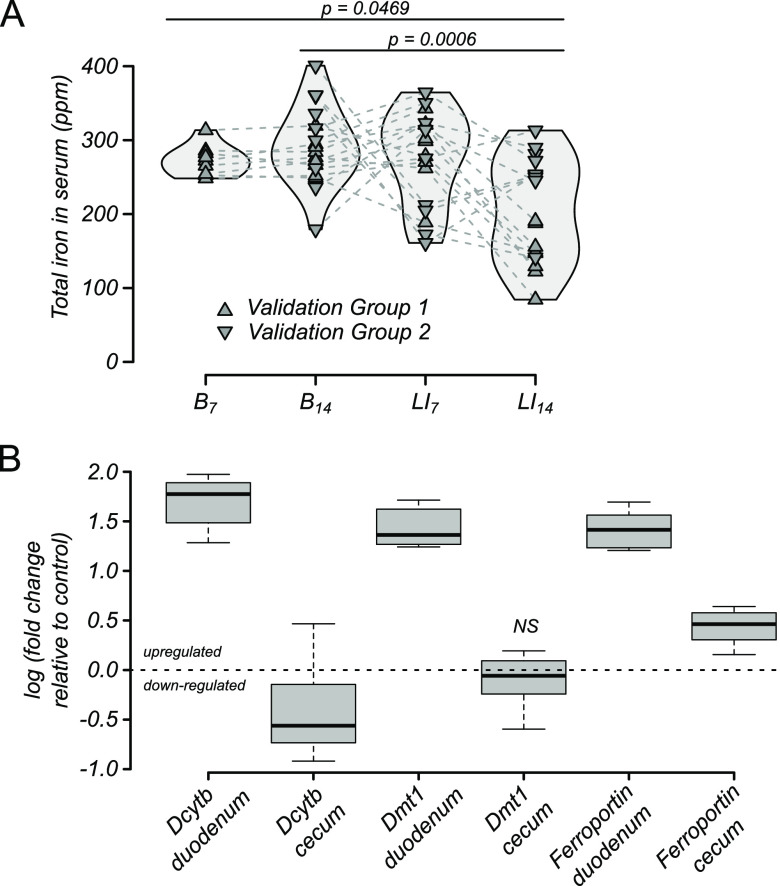
FIG 3.
Host response to LI challenge. (A) Total serum iron in mice throughout baseline (B7 and B14) and LI challenge (LI7 and LI14) in mice shown in Fig. 2. All P values represent paired (nonparametric) Wilcoxon rank sum tests with Benjamini-Hochberg correction. (B) Iron-responsive gene expression in mice after 2 weeks of LI challenge. The only nonsignificant change in gene expression compared to control mice (P > 0.05 by t test) was Dmt1 in cecal tissue.

