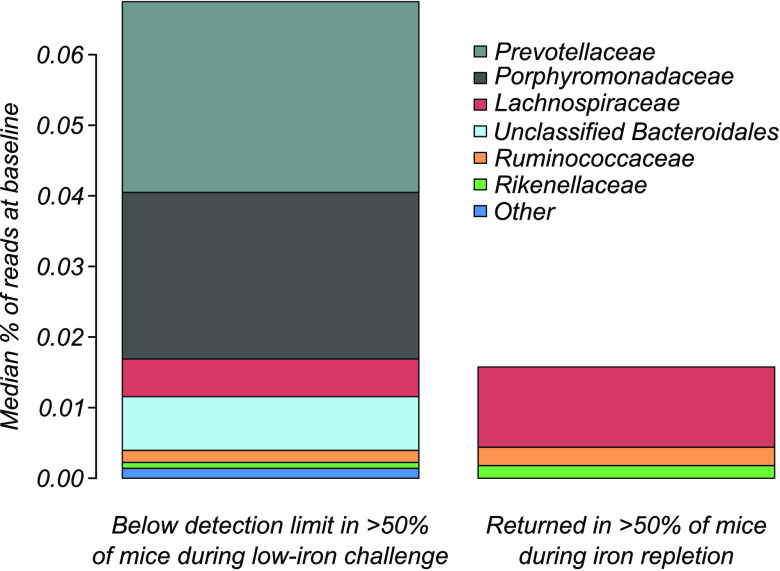
FIG 7.
OTUs most affected by LI challenge. Random forest analysis identified specific OTUs most affected by LI challenge. These OTUs were present at appreciable amounts at baseline, fell below the detection limit during LI challenge (left), and were either able to recover (right) or remained undetectable.

