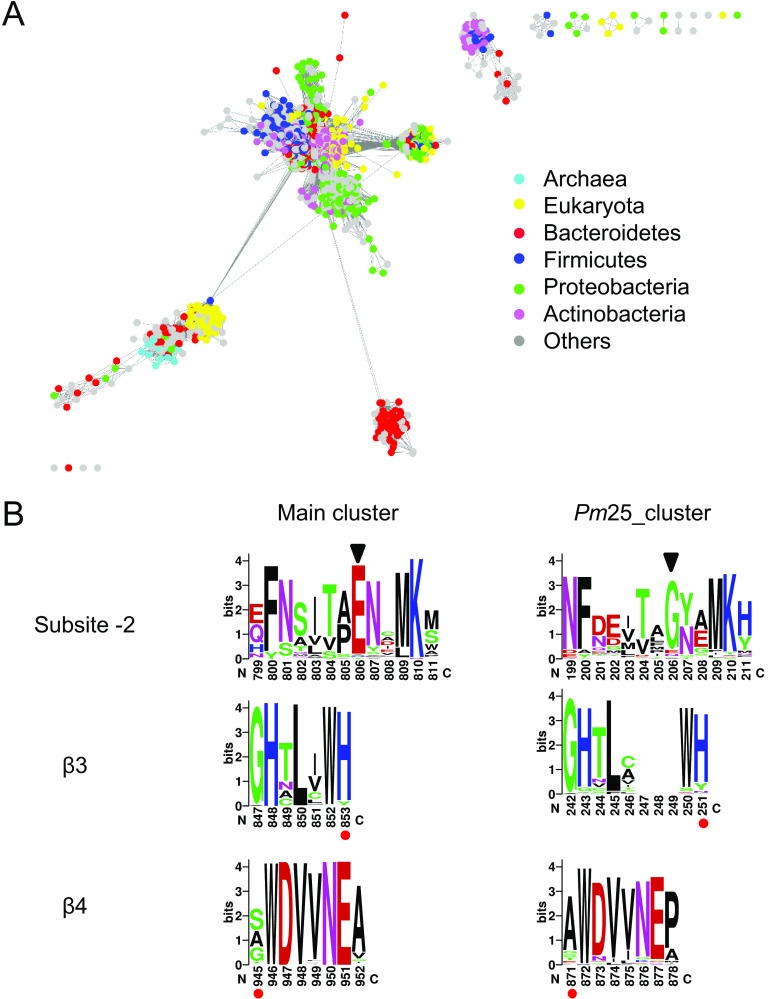
FIG 2.
Sequence analysis of GH10 xylanase. (A) SSN of GH10 xylanase in CAZy database. The nodes are colored by the taxonomic annotation listed on the right. (B) Sequence logos of different motifs located at subsite −2, β3, and β4 of GH10 sequences. The length of amino acid sequence between β3 and β4 can be deduced from the sequence number with red dots underneath.

