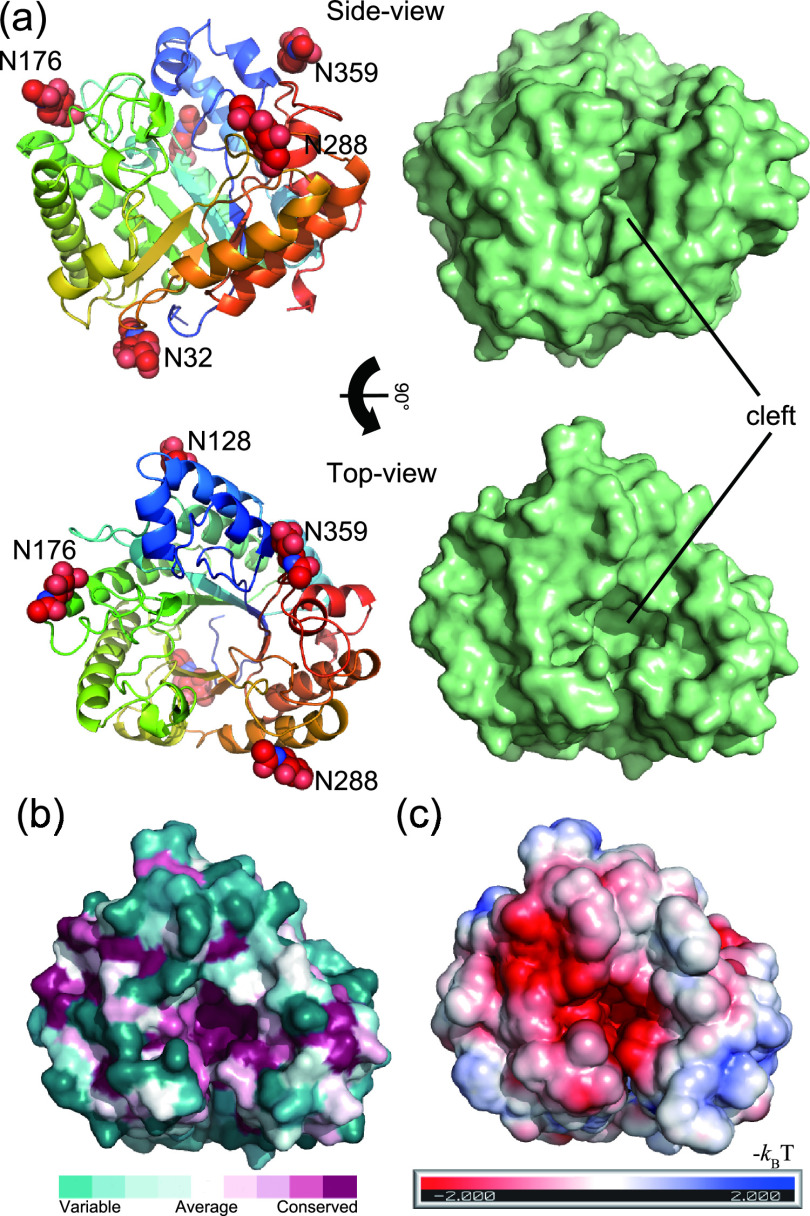
FIG 3.
Structure of rAoRutM. (a) Ribbon (left) and surface (right) representations with side views (top) and top views (bottom) are shown. Five N-acetyl-d-glucosamine molecules are shown as red CPK (Corey-Pauling-Koltun) spheres in the ribbon representation. A catalytic cleft is also indicated. (b) Sequence conservation among homologous proteins is depicted using the ConSurf server with the top view of the surface representation. Conserved residues are shown with purple, while nonconserved variable residues are shown with green. (c) Electrostatic potential of enzyme surface (red, negative; blue, positive) calculated using the PBEQ-Solver server on a solvent-accessible surface with monosaccharide molecules.

