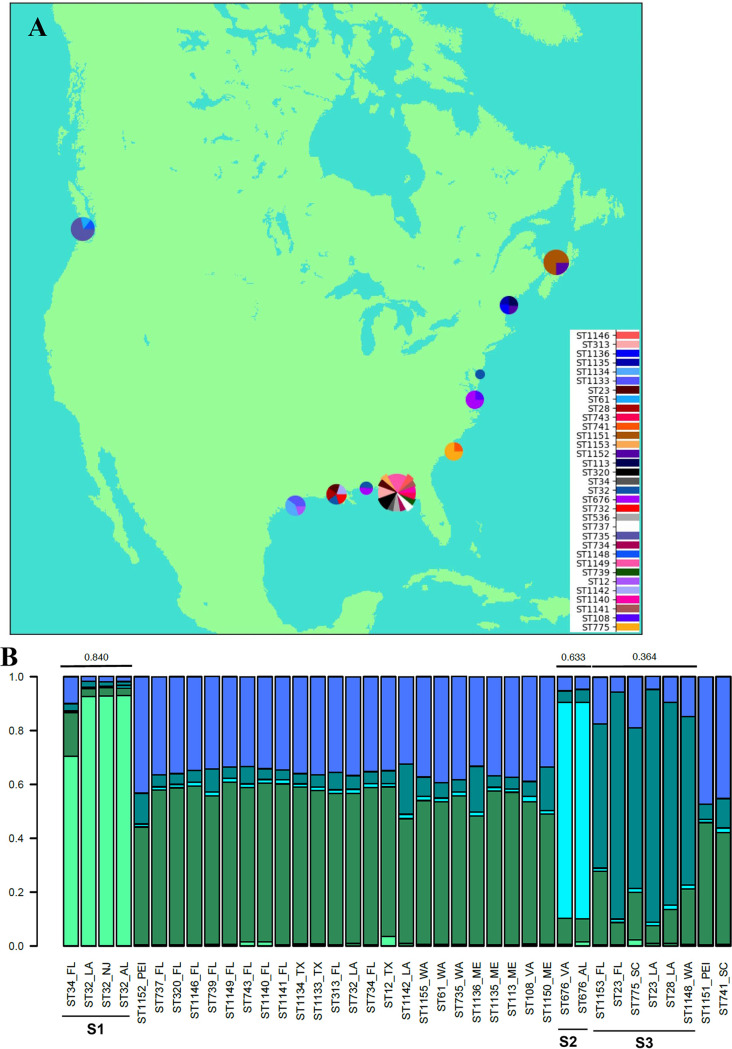
FIG 2.
Geographic distribution of V. parahaemolyticus isolates from oysters. (A) Geographic distribution of the identified STs. The map was constructed using Python 2.7 with the help of Basemap from mpl_toolkits.basemap and inset_axes from mpl_toolkits.axes_grid1.inset_locator. Pie charts were added at approximate locations of collection sites as demonstrated at http://www.geophysique.be/2010/11/15/matplotlib-basemap-tutorial-05-adding-some-pie-charts/. The size of each pie chart is proportional to the total number of isolates from that location. Pie slices are proportional to the number of times that an ST was isolated at each site. (B) Genetic/geographic structure among the oyster isolates. STRUCTURE was used with MLST genes and geographic locations as priors. The maximum value of ln P(D) corresponded to a k value of 5, which was the lowest k value for which the members within each cluster with an Fst value of >0.2 shared genes. Graphs were created in R version 3.2.2 using the default plotting functions.

