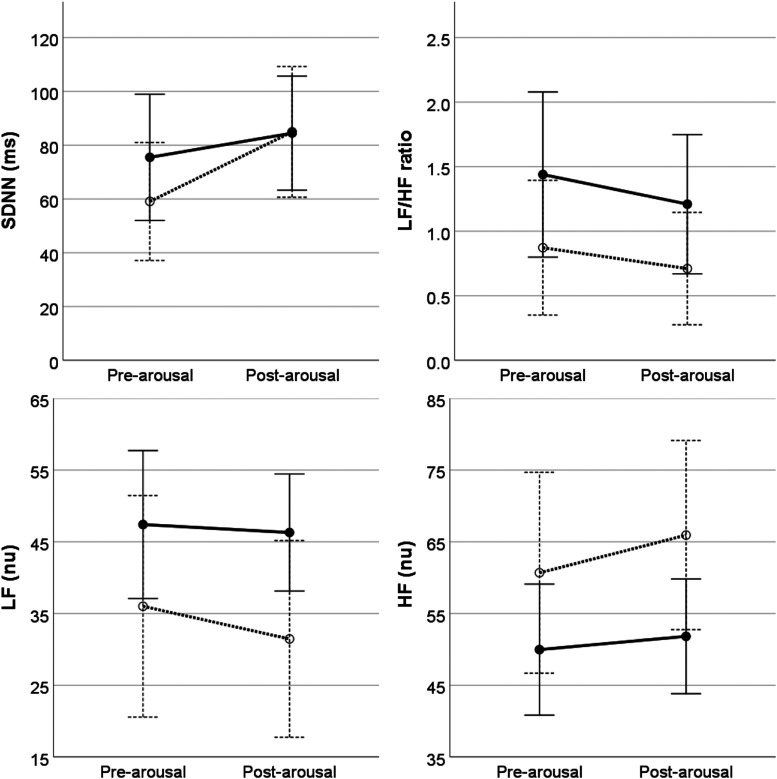
Figure 2. Heart rate variability measured before and after arousal events at baseline (dashed lines) and after 12 months of treatment (solid lines).
There was a main effect of treatment for LF and HF, with no effect of pre-arousal/post-arousal differences. After 12 months of treatment, LF increased (13.19 ± 5.9, 95% CI 1.29 to 24.9, P < 0.05) and HF decreased (−12.41 ± 5.4, 95% CI 1.43 to 23.4) relative to baseline. Error bars indicate ± 2 standard errors. CI = confidence interval, HF = high frequency, LF = low frequency, nu = normal units, SDNN = standard deviation of NN intervals.

