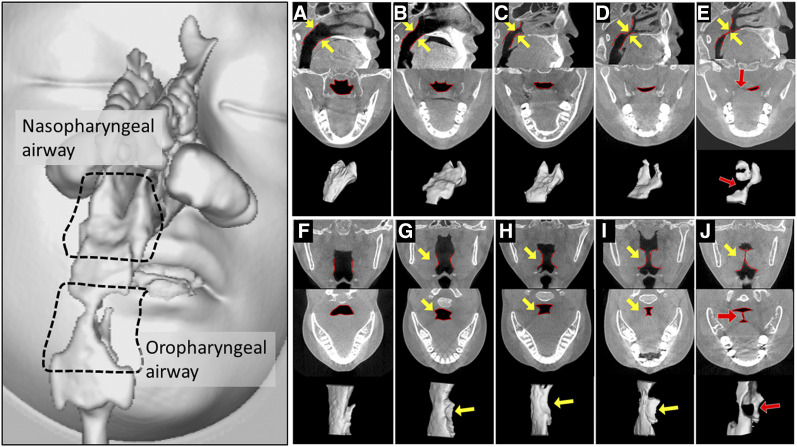
Figure 1. Measurement of adenoid and tonsil size.
Measurement of relative adenoid size (A–E). Upper figure: mid sagittal plane. Middle figures: cross section of nasopharyngeal airway of closest part. Lower figure: three-dimensional nasopharyngeal airway model from the right rear. The distance in the midsagittal plane from the posterior outline of the soft palate to the closest point on the adenoid tissue from cone-beam computed tomography images was used to classify the relative size of the adenoids into five groups. (A) Grade I was not present in adenoid. (B) Grade II adenoid extended quarter of the way to the midline (yellow arrow). (C) Grade IIl adenoid extended halfway to the midline (yellow arrow). (D) Grade IV adenoid extended three quarters of the way to the midline (yellow arrow). (E) Grade V adenoid partially occluded the airway (red arrow). Measurement of relative palatine tonsil size (F–J). Upper figure: coronal plane of oropharyngeal airway of closest part. Middle figure: horizontal plane of oropharyngeal airway of closest part. Lower figure: three-dimensional oropharyngeal airway model from the right rear. (F) Grade I was not present in hyperplasia of palatine tonsil. (G) Grade lI tonsils extended quarter of the way to the midline (yellow arrow). (H) Grade III tonsils extended halfway to the midline (yellow arrow). (I) Grade IV tonsils extended three quarters of the way to the midline (yellow arrow). (J) Grade V tonsils were completely obstructing the airway, also known as “kissing” tonsils (red arrow).

