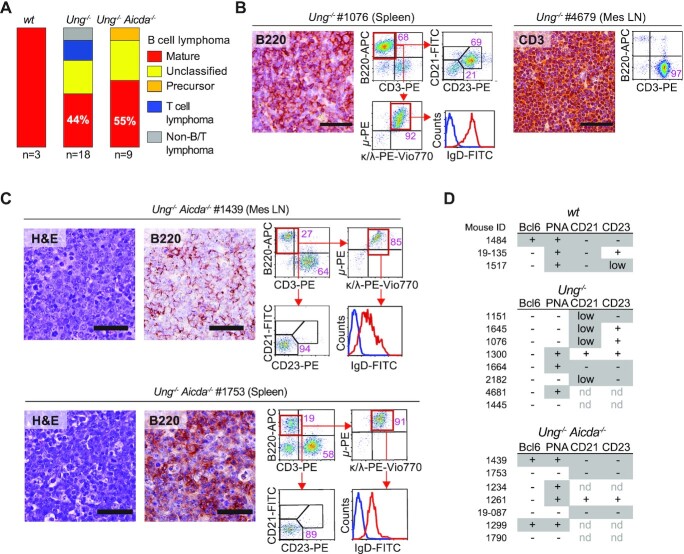
Figure 4.
Lymphoma spectrum in Ung−/− and Ung−/− Aicda−/− mice. (A) Proportion of lymphoma types found in each mouse line from the prospective cohort. (B) Examples of BCL and TCL in Ung−/− mice. Representative microscopy images of tissue sections stained by IHC with anti-B220 or anti-CD3 (bars = 50 μm) and flow cytometry plots. (C) Examples of BCL in Ung−/− Aicda−/− mice. Representative microscopy images of tissue sections stained with hematoxylin and eosin or by IHC with anti-B220 (bars = 50 μm), and flow cytometry plots. (D) Summary of the expression of the indicated markers monitored in BCL by IHC (Bcl6, PNA; see Supplementary Figure S5) or flow cytometry (CD21, CD23; see Supplementary Figure S4). Features typically found in activated (PNA+ Bcl6low CD21− CD23+), GC (Bcl6+ PNA+ CD21low CD23low/−) or post-GC (PNA− Bcl6− CD21− CD23−) B cells are shaded.

