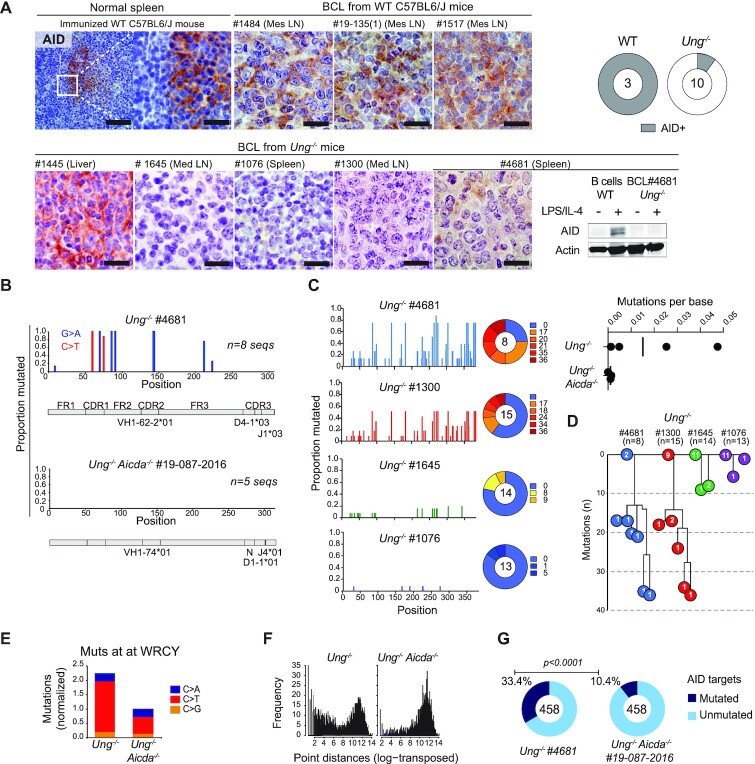
Figure 5.
AID expression and activity in Ung-deficient BCL. (A) Representative IHC for AID in BCL tissue sections from WT or Ung−/− mice. A splenic GC from an immunized WT mouse serves as a positive control. Bars = 20 μm. The pie charts compile the proportion of AID+ BCL out of the mice analyzed (total n at the center). All samples were stained simultaneously, imaged and processed identically for comparison. AID western blot for one Ung−/− BCL sample is shown next to WT B cells activated with LPS and IL-4. (B) SHM frequency per nucleotide position of the represented IgVH region of the indicated BCL. (C) Mutation frequency in the Sμ region of the indicated Ung−/− BCL. The pie chart shows the proportion of sequences with the indicated number of mutations. The dot plot (top right) shows the mutation frequency calculated for each Ung−/− BCL and three Ung−/− Aicda−/− BCLs used as controls for mutation background. (D) Dynastic relationship between the Sμ sequences obtained from each BCL. Circles indicate the number of sequences for each unique variant bearing the indicated number of mutations. (E) Frequency of mutations at C within a WRCY sequence context, normalized to the frequency of all mutations identified at C by whole genome sequencing of the indicated BCL. (F) Log-transformed distribution of distances between WRCY mutations from (F). (G) Pie charts with the proportion of AID off-targets containing coding region mutations in each BCL. P-value by Fisher’s exact test.

