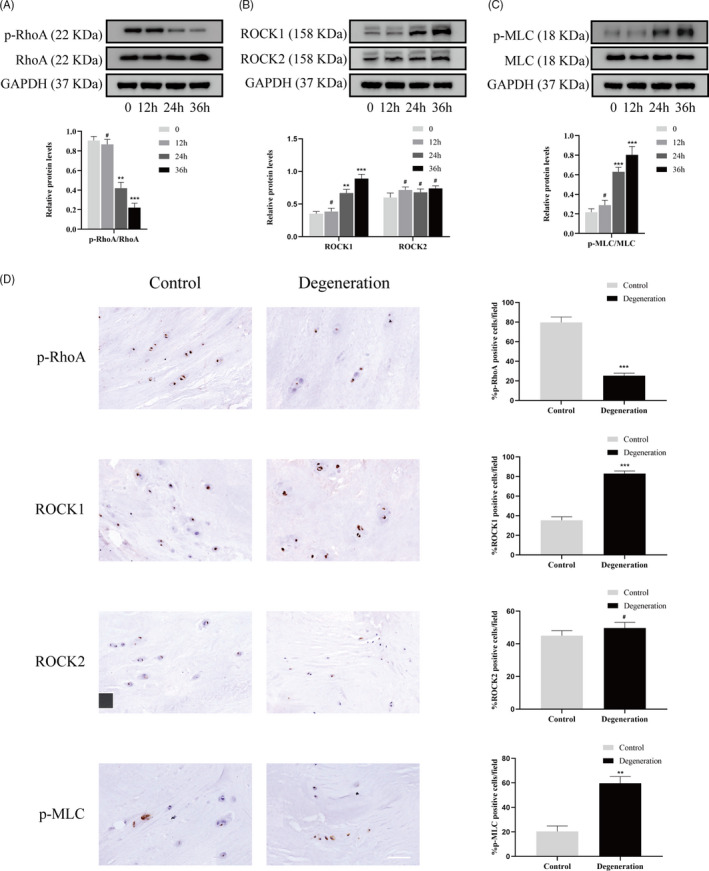
FIGURE 6.

Compression stress induced RhoA/ROCK1 pathway activation in human NP cells. The protein expression level of p‐RhoA and RhoA (A), ROCK1 and ROCK2 (B), p‐MLC and MLC (C) subjected to different compression time were measured by Western blot and analysed statistically in different groups. GAPDH was used as control. (D) Immunohistochemistry analysis of p‐RhoA, ROCK1, ROCK2 and p‐MLC in control and degeneration groups. Scale bar: 50 μm. Data were presented as the mean ± SD (n = 3). #No significance, vs control; *P < .05, vs control; **P < .01, vs control; ***P < .001, vs control
