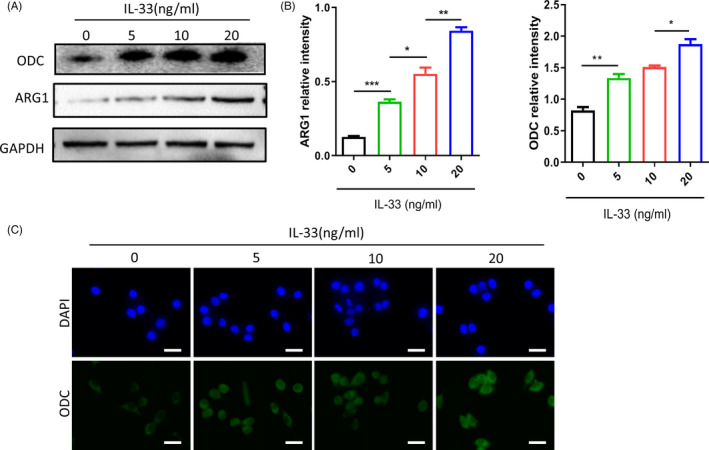
Figure 3.

IL‐33 induces macrophage ornithine decarboxylase (ODC) activation. A, ODC and arginase 1 (ARG1) protein levels were determined by Western blot, and GAPDH was used as a reference control. B, Relative intensity of ODC and ARG1 protein. C, Immunofluorescence staining for IL‐33–induced M2 macrophages. The green signal represents the staining of activated ODC, and the blue signal represents the DAPI‐stained nuclei (scale bar = 20 μm). *P < .05; **P < .01; ***P < .001. Bars indicate mean and SEM of triplicate experiments and show a representative experiment of at least 3 independent experiments performed for each panel
