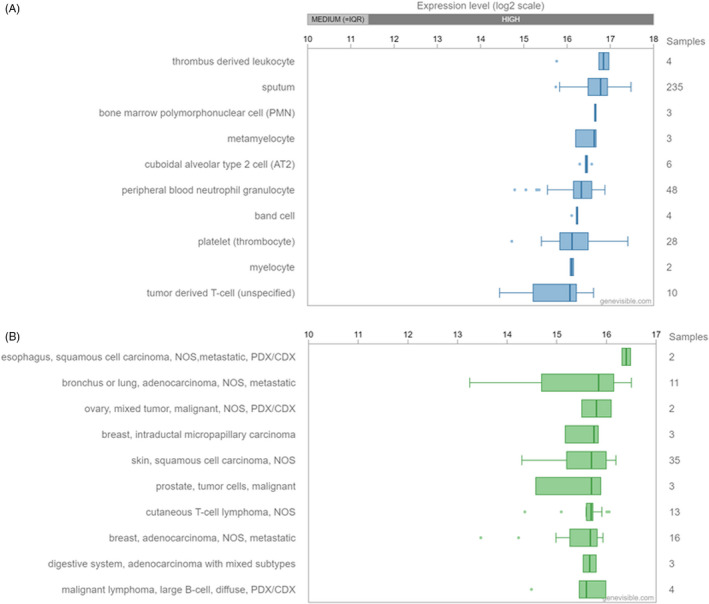
FIGURE 3.

(A) STAT3 expression analysis performed by Genevisible®, https://genevisible.com/search. STAT3 expression analysis across 518 tissues, showing the 10 most highly expressed, including leucocyte and T‐cell populations. (B) STAT3 expression analysis across 539 cancers, showing the 10 most highly expressed, including metastatic lung, breast and adenocarcinomas. STAT3, signal transducer and activator of transcription 3
