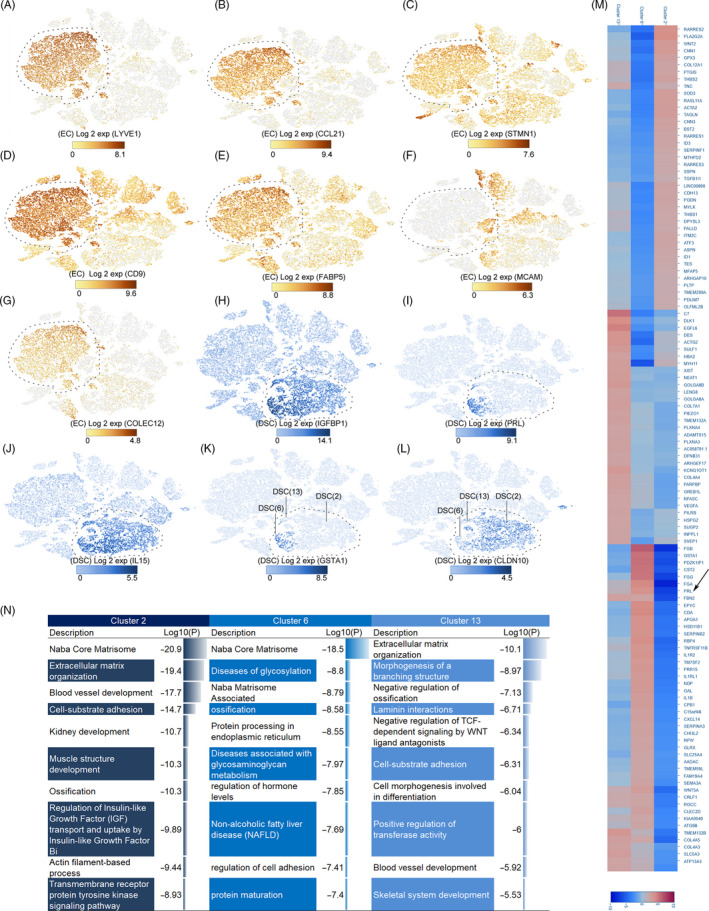
FIGURE 2.

Identification of major cell populations (endothelial cell, decidual stromal cell). A‐G, Identification of EC populations. Different figure numbers represent different markers. The cell type is indicated by a dotted line. A, LYVE1. B, CCL21. C, STMN1. D, CD9. E, FABP5. F, MCAM. G, COLEC12. H‐L, Identification of DSC group and subgroups. H, IGFBP1. I, PRL. J, IL‐15. K, GSTA1. L, CLDN10. M, Heat map of gene expression among three subgroups of DSCs. The arrow indicates differential expression of PRL in subgroups. N, Comparison of the functions of the three DSC subgroups; Log10(P) is the P‐value in log base 10. DSC, decidual stromal cell; EC, endothelial cell
