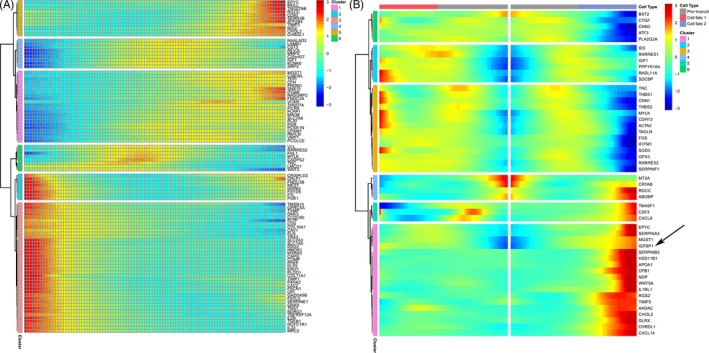
FIGURE 8.

Differential gene expression (DSC clusters 2, 6 and 13; and FB cluster 9) heat map of pseudotemporal ordering in decidua. A, Differential gene cluster heat map (for DSC clusters 2, 6 and 13; and FB cluster 9). Each column represents the average expression in the current cell state. The ‘cluster’ in this figure represents a cluster of genes with similar dynamic trends, which is different from the ‘cluster’ of cells in this article. B, Differential gene pseudotemporal expression trajectory map (for DSC clusters 2, 6, and 13; and FB cluster 9). The arrow indicates the expression of IGFBP1 gradually increased along the trajectory of cell fate 2. DSC, decidual stromal cell; FB, fibroblasts
