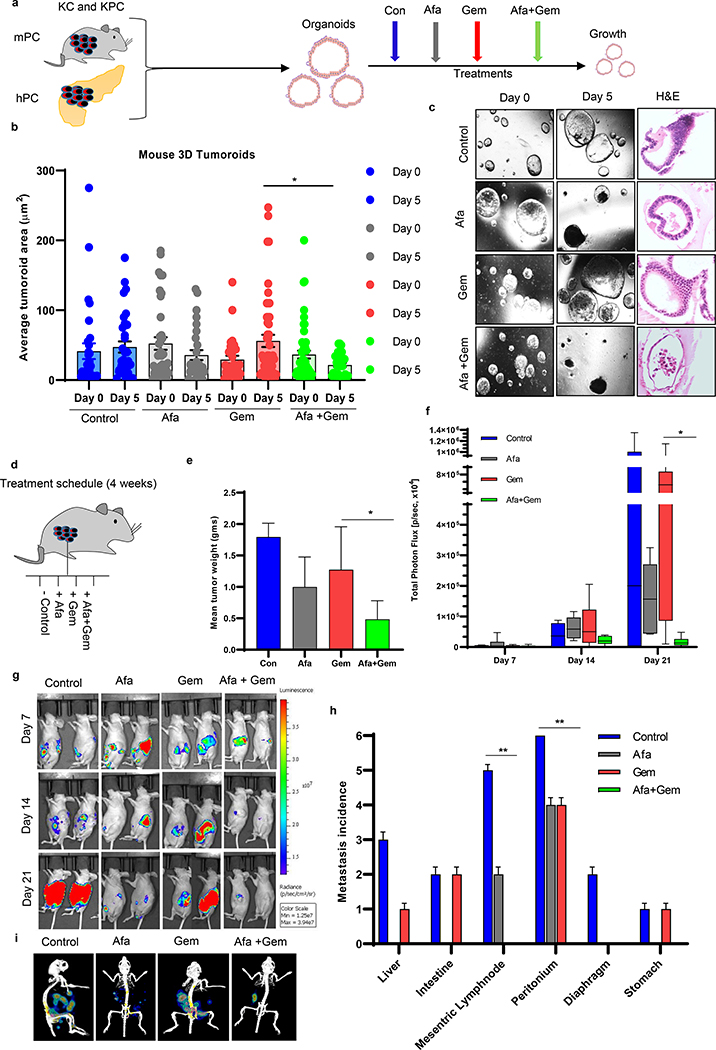
Fig.1. Effects of afatinib and gemcitabine on mouse pancreatic tumoroids and xenograft models.
a An experimental scheme shows murine (KC and KPC) and human tumoroids development and the treatment strategies. b Box and whisker plots were demonstrating quantitative analysis of the average change in the size of KPC tumoroids treated with afatinib and gemcitabine alone and in combination over 5 days of treatment (N=25/group). c Light microscopic and hematoxylin and eosin (H&E)-stained images of KPC mouse PC tumoroids at days 0 and 5. d Study design and treatment strategies for in vivo PDAC orthotopic mouse experiments. e Bar graph showing mean tumor weights of xenografts (N=6/group) exposed to afatinib and /or gemcitabine for 3 weeks (*P<0.05). f Mice in various treatment conditions were injected (intraperitoneal) with D-luciferin (150 mg/kg body weight) and imaged after 10–15 minutes of administration. All the luminescence images were normalized to the same scale for each time point, and region of interest (ROI) were selected, and photons intensities in the ROIs were measured and quantified in the units of photons/second/cm2/steradian. Bar graph showing the quantification of total photon flux measured for each mouse during bioluminescence imaging on days 7, 14, and 21 day (N=6/group, *P<0.05). g Representative images of mice bearing orthotopic PC tumor and their response towards afatinib and gemcitabine as a single agent and in drug combination at days 7, 14, and 21 after the start of drug treatment. h After 3 weeks of treatment, mice were sacrificed, and the incidence of metastasis to internal organs of the mice was counted; the number of metastatic spots were noted for each organ/group (N=6/group). i Representative Bioluminescence images of mouse with metastasis incidence after treatment with afatinib and /or gemcitabine.

