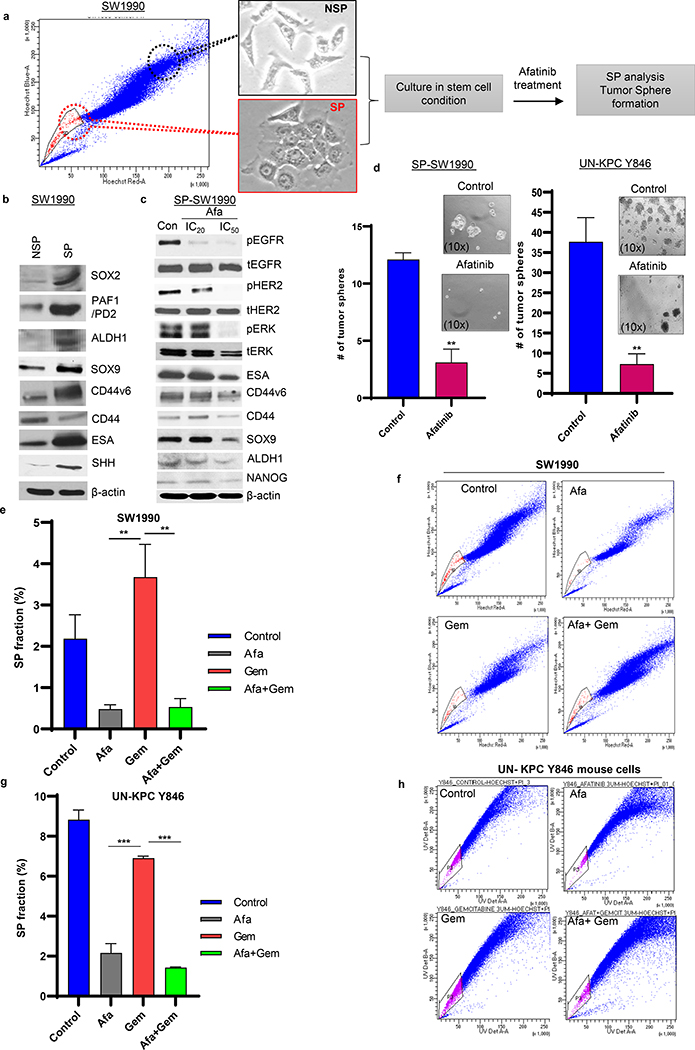
Fig.3. Afatinib inhibited human and mouse pancreatic cancer stem cells and stemness.
a Experimental design for side population (SP)/CSC isolation and functional characterization upon afatinib treatment. b Western blot analysis demonstrating CSC marker expression in the isolated SP/non-SP SW1990 PC cells. c Western blot analysis showing dose-dependent (IC20 and IC50) effects of afatinib and its response on CSC markers in PCSC cells. d Isolated SP/CSC population was seeded in low attachment plates and treated with IC50 concentrations of Afatinib. Bar graph depicting the average number of tumorspheres counts following afatinib treatment in SP cells isolated from SW1990 (left, N=3/group, **P<0.01) and mouse UN-KPC Y846 (right, N=3/group, ***P<0.001) PC cells. Representative light microscopic images showing tumor spheroids affected in response to no-drug and afatinib treatment (insert). e-h Human and mouse PC cells were exposed to afatinib, gemcitabine, and a combination of both for 48 hours. Following treatment, both SW1990 (e and f) and UN-KPC Y846 (g and h) PDAC cells were subjected to SP analysis (FACS) using the Hoechst staining method. The Bar graph represents the percentage of SP cells (using FACS analysis) affected upon drug treatment in SW1990 (N=3/group) and UN-KPC Y846 (N=3/group) PC cells (e and g). FACS plots showing affected SP fraction in treatment groups (Afatinib, Gemcitabine and Afatinib and Gemcitabine combination treatments) compared to unaffected controls PC cells (SW1990 and UN-KPC Y846) (f and h).

