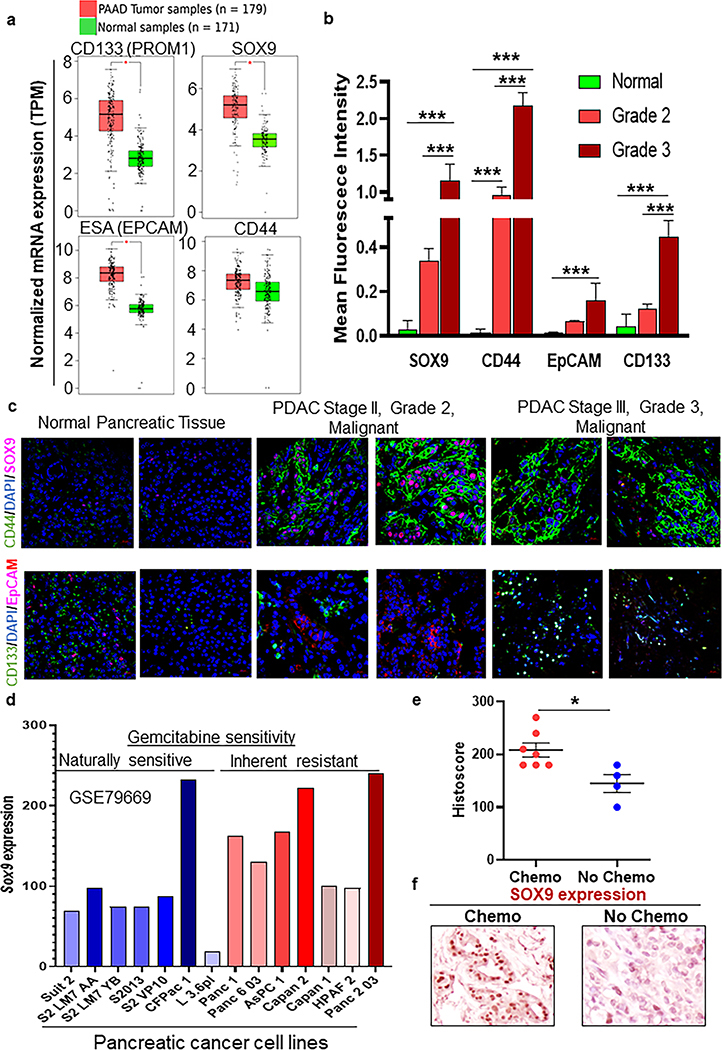
Fig.4. Cancer stem cell-associated self-renewal markers SOX9, CD44, EpCAM and CD133 expression in normal pancreas, grade 2 and grade 3 PDAC, chemo-treated and untreated pancreatic cancer tissues.
a Box plot representing the expression of vital cancer stem cell markers (PROM1, SOX9, EPCAM, and CD44) and self-renewal genes on PDAC patients (N=179) versus normal controls (N=171, *P<0.05). b Bar graph showing quantitative analysis of CSC markers (SOX9, CD44, EpCAM, and CD133) expression in a stained tissue microarray (Normal =3, Grade 2= 6, and Grade 3 =6). Mean fluorescent intensities for Red, Green, and Blue (DAPI) stains were noted for each image. Red and green staining was then normalized by blue stain to get normalized mean fluorescent intensities (*P<0.05, **P<0.01, ***P<0.001). c Representative immunofluorescence images of human tissue microarray with pancreatic cancer and normal pancreatic cores stained with SOX9, CD44, EpCAM, and CD133. CSC and self-renewal markers expression in normal pancreatic and PDAC pathological stage II, tumor grade 2 malignant, PDAC pathological stage III, tumor grade 3 malignant, tissues. d Bar graph depicting relative expression of SOX9 between gemcitabine sensitive and resistant PDAC cell lines. e Dot plot demonstrating IHC quantification of Sox 9 expression in a subset of patients treated with chemotherapy (N=7) and no chemotherapy (N=4, *P<0.05). f Representative images were showing SOX9 protein expression in chemotherapy-treated and un-treated human PDAC tissues.

