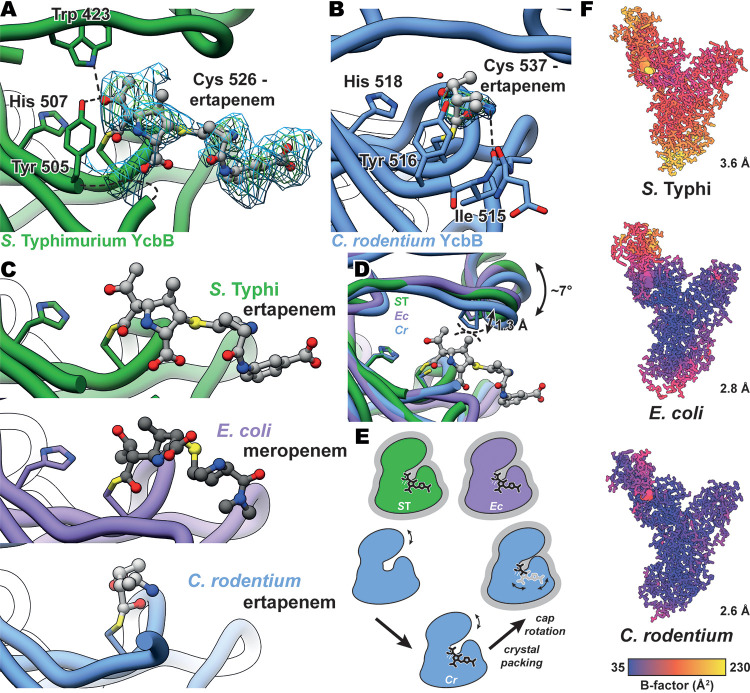
FIG 3.
Carbapenem acylation of YcbB and movement of the capping loop subdomain. (A) mFo-DFc simulated annealing omit map for ertapenem-acylated Cys526 of S. Typhi YcbB, contoured at 2 and 2.5 σ and indicated in blue and green, respectively. S. Typhi YcbB is in green, ertapenem is in light gray, and selected residues and ertapenem are colored by heteroatom. Hydrogen bonding between ertapenem, Tyr507, and Trp423 is represented with dashed lines. Some poorly resolved density is seen for residues 502 to 504, which are represented with a curved dashed line. (B) mFo-DFc simulated annealing omit map for the ertapenem-acylated Cys537 of C. rodentium YcbB, contoured at 2 and 2.5 σ and indicated in blue and green, respectively. C. rodentium YcbB is indicated in blue, and the remainder is colored as described for panel A. Hydrogen bonding between ertapenem and the backbone carbonyl of Ile515 is represented with dashed lines. (C) Comparisons of ertapenem-S. Typhi YcbB (gray/green), ertapenem-C. rodentium YcbB (gray/blue), and meropenem-E. coli YcbB (gray/purple—PDB ID 6NTW [13]). Acylated catalytic cystine and catalytic histidine residues are shown. Similar orientations of the active-site residues are seen among all three homologues, while the general positions of both ertapenem and meropenem are conserved among the S. Typhi and E. coli structures, with the benzoic acid extension protruding away from the active site in the ertapenem-S. Typhi YcbB structure. (D) An overlay of S. Typhi (ST), E. coli (Ec), and C. rodentium (Cr) YcbB structures, highlighting capping loop rearrangements between the three. Modest rearrangements of the capping loop are seen to occlude the stability of ertapenem in the crystal structure of C. rodentium YcbB, likely through the steric interference shown in dashed lines between an overlay of ertapenem and C. rodentium YcbB. (E) A schematic representation of the capping loop rearrangement and the impact on the acylation state during crystallization. Representations of states with structures are additionally outlined in gray. (F) B-factors of S. Typhi, E. coli, and C. rodentium YcbB structures, highlighting the increased levels of B-factors of the capping loop within each model and the increased overall levels of B-factors scaling with resolution (plotted in UCSF Chimera [42]).

