
Figure 1. Disruption of REV-ERBα and β in hepatocytes remodels the liver diurnal rhythmic transcriptome and lipid metabolism.
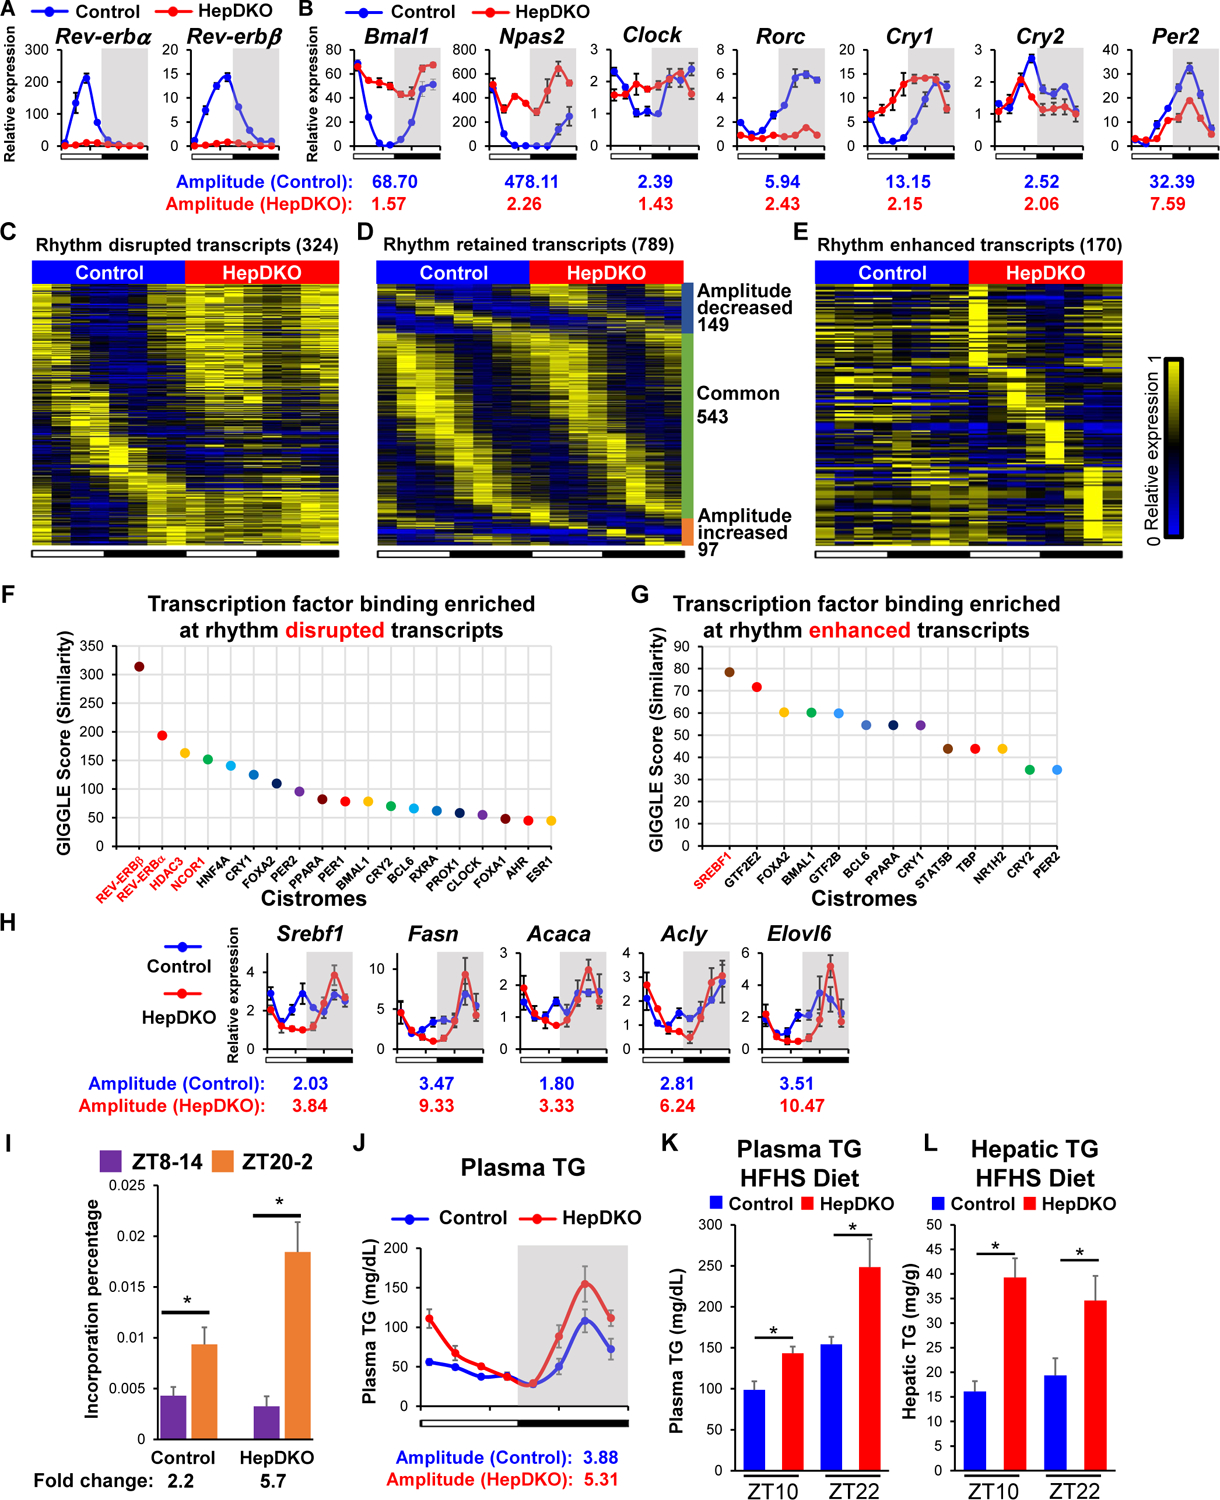
(A–B) Relative mRNA expression of Rev-erbα and Rev-erbβ (A) and REV-ERBs target genes (B) in control and HepDKO livers. (C–E) Heat map of the relative expression of rhythm disrupted (C), retained (D), and enhanced (E) transcripts in control and HepDKO livers. The color bar indicates the scale used to show the expression of transcripts across eight time points, with the highest expression normalized to 1. JTK_CYCLE, adjusted p < 0.01, 21 ≤ period (t) ≤ 24 hr, peak to trough ratio > 2 (n = 3 per time point). (F–G) Transcription factor binding similarity screening on rhythm disrupted (F) and enhanced (G) transcripts based on all published liver cistromes from CistromeDB (11). (H) Relative mRNA expression of Srebf1 and its target genes in control and HepDKO livers (n = 4–6 per time point). (I) Incorporation of deuterated water into liver fatty acids was measured in mice 6 hours after oral gavage of D2O either at ZT8 or at ZT20. Data are presented as mean ± SEM. *p < 0.05 in Student’s t-test (n = 6 mice per group). (J) Serum triglyceride measurements in control and HepDKO mice. (K–L) Serum triglyceride (K) and hepatic triglyceride (L) measurements in HFHS-fed control and HepDKO mice. Data are presented as mean ± SEM (n = 4–6 per time point).