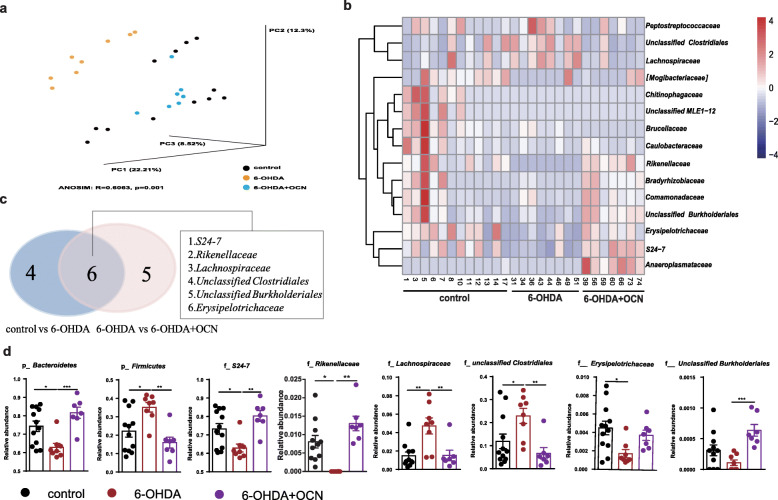
Fig. 4.
OCN administration modulated gut microbiota dysbiosis in 6-OHDA-induced PD mice. a Principal coordinate analysis (PCoA) plot based on unweighted UniFrac distance. b Heatmap of the gut microbiota taxa showed different RAs in different groups. Color key represents the RAs. c Venn diagram of differential taxa comparisons between control versus 6-OHDA and 6-OHDA+OCN versus 6-OHDA group. d Bar plots of the RAs of p_Bacteroidetes and p_Firmicutes at the phylum level and of overlapping taxa at the family levels indicated in c. The dosage of OCN was 4 μg/kg. n = 7–12 per group, data represent the mean ± SEM, p < 0.05 was set as the threshold for significance by one-way ANOVA followed by post hoc comparisons using Tukey’s test for multiple groups’ comparisons, *p < 0.05, **p < 0.01, ***p < 0.001, ****p < 0.0001

