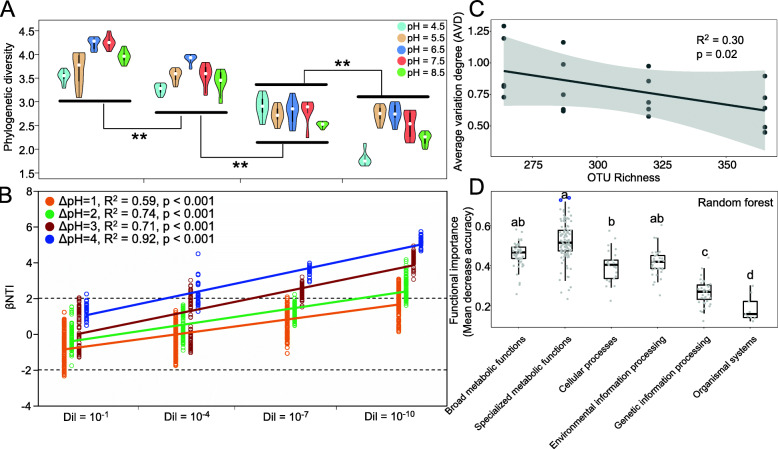
Fig. 1.
Diversity and variations of the re-assembled bacterial communities. a The variances of bacterial phylogenetic diversity indices across soil pH and dilution gradients. b The relationship between βNTI and dilution level. ΔpH is the differences in soil pH. c The relationship between bacterial OTU richness and average variation degree (AVD) of re-assembled bacterial communities. Asterisks indicate significance: **P value < 0.01 based on two-sided tests. Lg(Dil): Lg transformed dilution level. d The importance of functional categories based on random forest method (mtry = 9, ntree = 660) with a OOB (out-of-bag) estimate of error rate of 8.75%. Different letters indicate significant differences (P value < 0.05) between functional categories according to Duncan’s multiple comparison. The top two points of specialized metabolic functions labeled by blue outer rings indicate the functions of “nitrogen metabolism” (mean decrease accuracy values = 0.736) and “phosphonate and phosphinate metabolism” (mean decrease accuracy values = 0.749)

