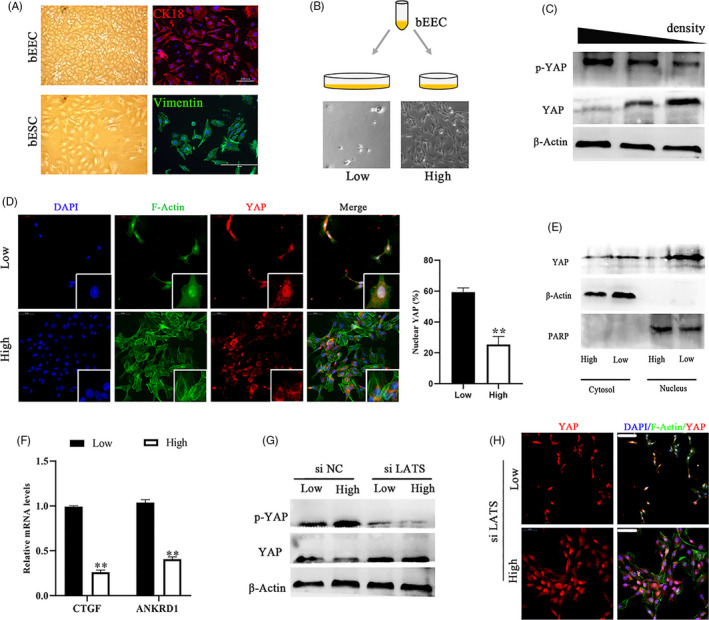
FIGURE 2.

YAP is regulated by cell density in a manner dependent on the Hippo pathway. A, Images of primary cultured bovine endometrial cells (left) and immunofluorescence images corresponding to cell type markers (right). bEECs, bovine endometrial epithelial cells, CK18; bESCs, bovine endometrial stromal cells, vimentin. Scale bars, 100 μm and 50 μm, n = 3. B, Schematic representation of different bEEC density culture methods and images of actual effects. The same number of cells were seeded in culture plates of different sizes. C, Protein expression of YAP and p‐YAP in bEECs at different cell densities, n = 3. D, Immunofluorescence images (left, n = 2) and quantification of the nuclear and cytoplasmic subcellular localization of YAP (right, n = 15) in bEECs, when grown at low/high densities. Scale bars, 50 μm. Enlarged = 10 μm. E, YAP expression in the cytosol and/or nucleus of bEECs grown at low/high density, n = 3. F, mRNA levels of CTGF and ANKRD1 in bEECs cultured at low/high density were detected by RT‐qPCR, n = 3. G, Protein expression of YAP in bEECs treated with siNC or siLATS at low/high density, n = 3. H, Representative immunofluorescence of YAP in bEECs treated with siLATS at low/high densities, n = 2. Scale bars, 50 μm. DAPI, blue, nuclei; F‐actin, green, cell boundaries; YAP, red. All experiments were repeated independently three times with similar results, n = 3. Experiments were repeated n times with two biological replicates. Data are shown as the mean ± SEM. P values were determined by an unpaired two‐sided t test. **P < .001. See also Figure S2A–C
