FIGURE 4.

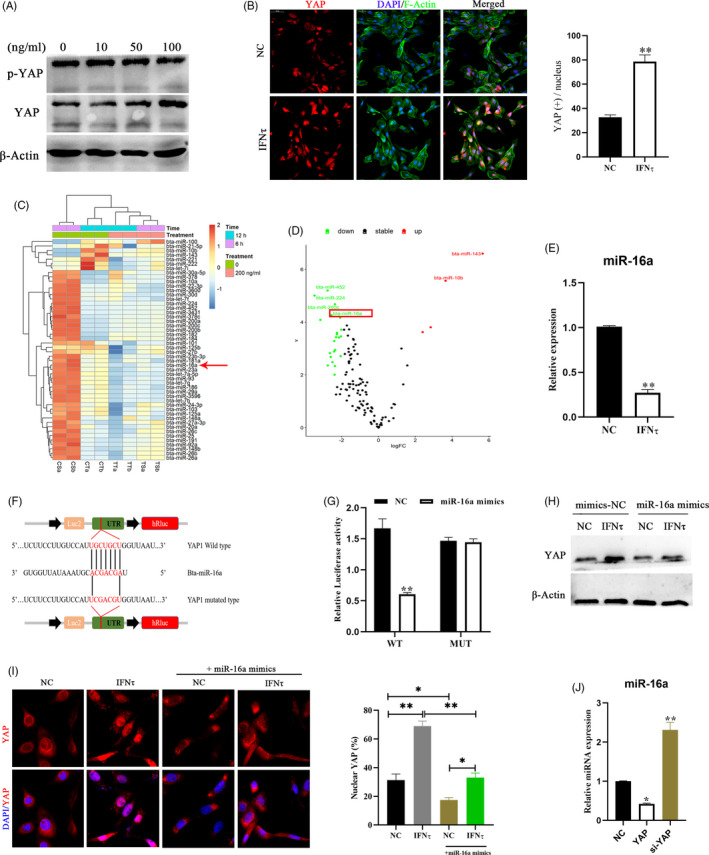
IFNτ mediates the regulation of YAP by decreasing the expression of miR‐16a. A, Protein expression levels of YAP detected in bEECs treated with 10, 50, or 100 ng/ml IFNτ for 24 hour by western blot, n = 3. B, Immunofluorescence images (left, n = 2) and quantification of YAP positive cells (right, n = 5) in bEECs treated with 100 ng/ml IFNτ. Scale bars, 50 μm. C, Heatmap showing commonly expressed miRNAs with significant expression variance. The colour scale indicates relative expression levels of miRNAs. CT and CS: PBS treatment for 12 hour and 6 hour, respectively. TS and TT: IFNτ treatment for 12 hour and 6 hour, respectively. D, Volcano plot for abnormal expression of miRNAs after 12 hour of bovine epithelial cells treated with 100 ng/ml IFNτ. Differentially expressed miRNA were exhibited a 2‐fold change in expression with an adjusted P value of 0.05. E, RT‐qPCR analysis of relative miR‐16a expression levels in bEECs treated with 100 ng/ml IFNτ, n = 3. F, Schematic diagram showing dual‐luciferase reporter constructs harbouring the 3′‐UTR of YAP with the putative miR‐16a‐binding site. G, Luciferase activity was measured using the dual‐luciferase reporter assay system, n = 3. H, Expression of YAP protein after treatment with the indicated regimen, n = 3. I, Confocal immunofluorescence images (n = 2) and quantification of YAP positive cells (right, n = 15) in bEECs transfected with mimics‐NC or miR‐16a mimics and treated with IFNτ (100 ng/ml) or PBS. J, Expression levels of miR‐16a in bEECs transfected with siNC, siYAP and pcDNA3.1(+) YAP were detected using RT‐qPCR, n = 3. Experiments were repeated n times with two biological replicates. Data are shown as the mean ± SEM. P values were determined by an unpaired two‐sided t test (B, E), one‐way ANOVA (I, J) and two‐way ANOVA (G). *P < .05, **P < .01. See also Figure S3
